Delta Volume Candles [LucF]█ OVERVIEW
This indicator plots on-chart volume delta information using candles that can replace your normal candles, tops and bottoms appended to normal candles, optional MAs of those tops and bottoms levels, a divergence channel and a chart background. The indicator calculates volume delta using intrabar analysis, meaning that it uses the lower timeframe bars constituting each chart bar.
█ CONCEPTS
Volume Delta
The volume delta concept divides a bar's volume in "up" and "down" volumes. The delta is calculated by subtracting down volume from up volume. Many calculation techniques exist to isolate up and down volume within a bar. The simplest use the polarity of interbar price changes to assign their volume to up or down slots, e.g., On Balance Volume or the Klinger Oscillator . Others such as Chaikin Money Flow use assumptions based on a bar's OHLC values. The most precise calculation method uses tick data and assigns the volume of each tick to the up or down slot depending on whether the transaction occurs at the bid or ask price. While this technique is ideal, it requires huge amounts of data on historical bars, which considerably limits the historical depth of charts and the number of symbols for which tick data is available. Furthermore, historical tick data is not yet available on TradingView.
This indicator uses intrabar analysis to achieve a compromise between the simplest and most precise methods of calculating volume delta. It is currently the most precise method usable on TradingView charts. TradingView's Volume Profile built-in indicators use it, as do the CVD - Cumulative Volume Delta Candles and CVD - Cumulative Volume Delta (Chart) indicators published from the TradingView account . My Delta Volume Channels and Volume Delta Columns Pro indicators also use intrabar analysis. Other volume delta indicators such as my Realtime 5D Profile use realtime chart updates to calculate volume delta without intrabar analysis, but that type of indicator only works in real time; they cannot calculate on historical bars.
This is the logic I use to determine the polarity of intrabars, which determines the up or down slot where its volume is added:
• If the intrabar's open and close values are different, their relative position is used.
• If the intrabar's open and close values are the same, the difference between the intrabar's close and the previous intrabar's close is used.
• As a last resort, when there is no movement during an intrabar, and it closes at the same price as the previous intrabar, the last known polarity is used.
Once all intrabars making up a chart bar have been analyzed and the up or down property of each intrabar's volume determined, the up volumes are added, and the down volumes subtracted. The resulting value is volume delta for that chart bar, which can be used as an estimate of the buying/selling pressure on an instrument. Not all markets have volume information. Without it, this indicator is useless.
Intrabar analysis
Intrabars are chart bars at a lower timeframe than the chart's. The timeframe used to access intrabars determines the number of intrabars accessible for each chart bar. On a 1H chart, each chart bar of an active market will, for example, usually contain 60 bars at the lower timeframe of 1min, provided there was market activity during each minute of the hour.
This indicator automatically calculates an appropriate lower timeframe using the chart's timeframe and the settings you use in the script's "Intrabars" section of the inputs. As it can access lower timeframes as small as seconds when available, the indicator can be used on charts at relatively small timeframes such as 1min, provided the market is active enough to produce bars at second timeframes.
The quantity of intrabars analyzed in each chart bar determines:
• The precision of calculations (more intrabars yield more precise results).
• The chart coverage of calculations (there is a 100K limit to the quantity of intrabars that can be analyzed on any chart,
so the more intrabars you analyze per chart bar, the less chart bars can be calculated by the indicator).
The information box displayed at the bottom right of the chart shows the lower timeframe used for intrabars, as well as the average number of intrabars detected for chart bars and statistics on chart coverage.
Balances
This indicator calculates five balances from volume delta values. The balances are oscillators with a zero centerline; positive values are bullish, and negative values are bearish. It is important to understand the balances as they can be used to:
• Color candle bodies.
• Calculate body and top and bottom divergences.
• Color an EMA channel.
• Color the chart's background.
• Configure markers and alerts.
The five balances are:
1 — Bar Balance : This is the only balance using instant values; it is simply the subtraction of the down volume from the up volume on the bar, so the instant volume delta for that bar.
2 — Average Balance : Calculates a distinct EMA for both the up and down volumes, and subtracts the down EMA from the up EMA.
The result is akin to MACD's histogram because it is the subtraction of two moving averages.
3 — Momentum Balance : Starts by calculating, separately for both up and down volumes, the difference between the same EMAs used in "Average Balance" and
an SMA of twice the period used for the "Average Balance" EMAs. The difference for the up side is subtracted from the difference for the down side,
and an RSI of that value is calculated and brought over the −50/+50 scale.
4 — Relative Balance : The reference values used in the calculation are the up and down EMAs used in the "Average Balance".
From those, we calculate two intermediate values using how much the instant up and down volumes on the bar exceed their respective EMA — but with a twist.
If the bar's up volume does not exceed the EMA of up volume, a zero value is used. The same goes for the down volume with the EMA of down volume.
Once we have our two intermediate values for the up and down volumes exceeding their respective MA, we subtract them. The final value is an ALMA of that subtraction.
The rationale behind using zero values when the bar's up/down volume does not exceed its EMA is to only take into account the more significant volume.
If both instant volume values exceed their MA, then the difference between the two is the signal's value.
The signal is called "relative" because the intermediate values are the difference between the instant up/down volumes and their respective MA.
This balance flatlines when the bar's up/down volumes do not exceed their EMAs, which makes it useful to spot areas where trader interest dwindles, such as consolidations.
The smaller the period of the final value's ALMA, the more easily it will flatline. These flat zones should be considered no-trade zones.
5 — Percent Balance : This balance is the ALMA of the ratio of the "Bar Balance" over the total volume for that bar.
From the balances and marker conditions, two more values are calculated:
1 — Marker Bias : This sums the up/down (+1/‒1) occurrences of the markers 1 to 4 over a period you define, so it ranges from −4 to +4, times the period.
Its calculation will depend on the modes used to calculate markers 3 and 4.
2 — Combined Balances : This is the sum of the bull/bear (+1/−1) states of each of the five balances, so it ranges from −5 to +5.
The periods for all of these balances can be configured in the "Periods" section at the bottom of the script's inputs. As you cannot see the balances on the chart, you can use my Volume Delta Columns Pro indicator in a pane; it can plot the same balances, so you will be able to analyze them.
Divergences
In the context of this indicator, a divergence is any bar where the bear/bull state of a balance (above/below its zero centerline) diverges from the polarity of a chart bar. No directional bias is assigned to divergences when they occur. Candle bodies and tops/bottoms can each be colored differently on divergences detected from distinct balances.
Divergence Channel
The divergence channel is the space between two levels (by default, the bar's open and close ) saved when divergences occur. When price (by default the close ) has breached a channel and a new divergence occurs, a new channel is created. Until that new channel is breached, bars where additional divergences occur will expand the channel's levels if the bar's price points are outside the channel.
Prices breaches of the divergence channel will change its state. Divergence channels can be in one of three different states:
• Bull (green): Price has breached the channel to the upside.
• Bear (red): Price has breached the channel to the downside.
• Neutral (gray): The channel has not yet been breached.
█ HOW TO USE THE INDICATOR
I do not make videos to explain how to use my indicators. I do, however, try hard to include in their description everything one needs to understand what they do. From there, it's up to you to explore and figure out if they can be useful in your trading practice. Communicating in videos what this description and the script's tooltips contain would make for very long videos that would likely exceed the attention span of most people who find this description too long. There is no quick way to understand an indicator such as this one because it uses many different concepts and has quite a bit of settings one can use to modify its visuals and behavior — thus how one uses it. I will happily answer questions on the inner workings of the indicator, but I do not answer questions like "How do I trade using this indicator?" A useful answer to that question would require an in-depth analysis of who you are, your trading methodology and objectives, which I do not have time for. I do not teach trading.
Start by loading the indicator on an active chart containing volume information. See here if you need help.
The default configuration displays:
• Normal candles where the bodies are only colored if the bar's volume has increased since the last bar.
If you want to use this indicator's candles, you may want to disable your chart's candles by clicking the eye icon to the right of the symbol's name in the top left of the chart.
• A top or bottom appended to the normal candles. It represents the difference between up and down volume for that bar
and is positioned at the top or bottom, depending on its polarity. If up volume is greater than down volume, a top is displayed. If down volume is greater, a bottom is plotted.
The size of tops and bottoms is determined by calculating a factor which is the proportion of volume delta over the bar's total volume.
That factor is then used to calculate the top or bottom size relative to a baseline of the average candle body size of the last 100 bars.
• An information box in the bottom right displaying intrabar and chart coverage information.
• A light red background when the intrabar volume differs from the chart's volume by more than 1%.
The script's inputs contain tooltips explaining most of the fields. I will not repeat them here. Following is a brief description of each section of the indicator's inputs which will give you an idea of what the indicator can do:
Normal Candles is where you configure the replacement candles plotted by the script. You can choose from different coloring schemes for their bodies and specify a unique color for bodies where a divergence calculated using the method you choose occurs.
Volume Tops & Botttoms is where you configure the display of tops and bottoms, and their EMAs. The EMAs are calculated from the high point of tops and the low point of bottoms. They can act as a channel to evaluate price, and you can choose to color the channel using a gradient reflecting the advances/declines in the balance of your choice.
Divergence Channel is where you set up the appearance and behavior of the divergence channel. These areas represent levels where price and volume delta information do not converge. They can be interpreted as regions with no clear direction from where one will look for breaches. You can configure the channel to take into account one or both types of divergences you have configured for candle bodies and tops/bottoms.
Background allows you to configure a gradient background color that reflects the advances/declines in the balance of your choice. You can use this to provide context to the volume delta values from bars. You can also control the background color displayed on volume discrepancies between the intrabar and the chart's timeframe.
Intrabars is where you choose the calculation mode determining the lower timeframe used to access intrabars. The indicator uses the chart's timeframe and the type of market you are on to calculate the lower timeframe. Your setting there should reflect which compromise you prefer between the precision of calculations and chart coverage. This is also where you control the display of the information box in the lower right corner of the chart.
Markers allows you to control the plotting of chart markers on different conditions. Their configuration determines when alerts generated from the indicator will fire. Note that in order to generate alerts from this script, they must be created from your chart. See this Help Center page to learn how. Only the last 500 markers will be visible on the chart, but this will not affect the generation of alerts.
Periods is where you configure the periods for the balances and the EMAs used in the indicator.
The raw values calculated by this script can be inspected using the Data Window.
█ INTERPRETATION
Rightly or wrongly, volume delta is considered by many a useful complement to the interpretation of price action. I use it extensively in an attempt to find convergence between my read of volume delta and price movement — not so much as a predictor of future price movement. No system or person can predict the future. Accordingly, I consider people who speak or act as if they know the future with certainty to be dangerous to themselves and others; they are charlatans, imprudent or blissfully ignorant.
I try to avoid elaborate volume delta interpretation schemes involving too many variables and prefer to keep things simple:
• Trends that have more chances of continuing should be accompanied by VD of the same polarity.
In trends, I am looking for "slow and steady". I work from the assumption that traders and systems often overreact, which translates into unproductive volatility.
Wild trends are more susceptible to overreactions.
• I prefer steady VD values over wildly increasing ones, as large VD increases often come with increased price volatility, which can backfire.
Large VD values caused by stopping volume will also often occur on trend reversals with abnormally high candles.
• Prices escaping divergence channels may be leading a trend in that direction, although there is no telling how long that trend will last; could be just a few bars or hundreds.
When price is in a channel, shifts in VD balances can sometimes give us an idea of the direction where price has the most chance of breaking.
• Dwindling VD will often indicate trend exhaustion and predate reversals by many bars, but the problem is that mere pauses in a trend will often produce the same behavior in VD.
I think it is too perilous to infer rigidly from VD decreases.
Divergence Channel
Here I have configured the divergence channels to be visible. First, I set the bodies to display divergences on the default Bar Balance. They are indicated by yellow bodies. Then I activated the divergence channels by choosing to draw levels on body divergences and checked the "Fill" checkbox to fill the channel with the same color as the levels. The divergence channel is best understood as a direction-less area from where a breach can be acted on if other variables converge with the breach's direction:
Tops and Bottoms EMAs
I find these EMAs rather interesting. They have no equivalent elsewhere, as they are calculated from the top and bottom values this indicator plots. The only similarity they have with volume-weighted MAs, including VWAP, is that they use price and volume. This indicator's Tops and Bottoms EMAs, however, use the price and volume delta. While the channel differs from other channels in how it is calculated, it can be used like others, as a baseline from which to evaluate price movement or, alternatively, as stop levels. Remember that you can change the period used for the EMAs in the "Periods" section of the inputs.
This chart shows the EMAs in action, filled with a gradient representing the advances/decline from the Momentum balance. Notice the anomaly in the chart's latest bars where the Momentum balance gradient has been indicating a bullish bias for some time, during which price was mostly below the EMAs. Price has just broken above the channel on positive VD. My interpretation of this situation would be that it is a risky opportunity for a long trade in the larger context where the market has been in a downtrend since the 5th. Intrepid traders choosing to enter here could do so with a "make or break" tight stop that will minimize their losses should the market continue its downtrend while hopefully preserving the potential upside of price continuing on the longer-term uptrend prevalent since the 28th:
█ NOTES
Volume
If you use indicators such as this one which depends on volume information, it is important to realize that the volume data they consume comes from data feeds, and that all data feeds are NOT created equally. Those who create the data feeds we use must make decisions concerning the nature of the transactions they tally and the way they are tallied in each feed, and these decisions affect the nature of our volume data. My Volume X-ray publication discusses some of the reasons why volume information from different timeframes, brokers/exchanges or sectors may vary considerably. I encourage you to read it. This indicator's display of a warning through a background color on volume discrepancies between the timeframe used to access intrabars and the chart's timeframe is an attempt to help you realize these variations in feeds. Don't take things for granted, and understand that the quality of a given feed's volume information affects the quality of the results this indicator calculates.
Markets as ecosystems
I believe it is perilous to think that behavioral patterns you discover in one market through the lens of this or any other indicator will necessarily port to other markets. While this may sometimes be the case, it will often not. Why is that? Because each market is its own ecosystem. As cities do, all markets share some common characteristics, but they also all have their idiosyncrasies. A proportion of a city's inhabitants is always composed of outsiders who come and go, but a core population of regulars and systems is usually the force that actually defines most of the city's observable characteristics. I believe markets work somewhat the same way; they may look the same, but if you live there for a while and pay attention, you will notice the idiosyncrasies. Some things that work in some markets will, accordingly, not work in others. Please keep that in mind when you draw conclusions.
On Up/Down or Buy/Sell Volume
Buying or selling volume are misnomers, as every unit of volume transacted is both bought and sold by two different traders. While this does not keep me from using the terms, there is no such thing as “buy only” or “sell only” volume. Trader lingo is riddled with peculiarities. Without access to order book information, traders work with the assumption that when price moves up during a bar, there was more buying pressure than selling pressure, just as when buy market orders take out limit ask orders in the order book at successively higher levels. The built-in volume indicator available on TradingView uses this logic to color the volume columns green or red. While this script’s calculations are more precise because it analyses intrabars to calculate its information, it uses pretty much the same imperfect logic. Until Pine scripts can have access to how much volume was transacted at the bid/ask prices, our volume delta calculations will remain a mere proxy.
Repainting
• The values calculated on the realtime bar will update as new information comes from the feed.
• Historical values may recalculate if the historical feed is updated or when calculations start from a new point in history.
• Markers and alerts will not repaint as they only occur on a bar's close. Keep this in mind when viewing markers on historical bars,
where one could understandably and incorrectly assume they appear at the bar's open.
To learn more about repainting, see the Pine Script™ User Manual's page on the subject .
Superfluity
In "The Bed of Procrustes", Nassim Nicholas Taleb writes: To bankrupt a fool, give him information . This indicator can display a lot of information. The inevitable adaptation period you will need to figure out how to use it should help you eliminate all the visuals you do not need. The more you eliminate, the easier it will be to focus on those that are the most useful to your trading practice. Don't be a fool.
█ THANKS
Thanks to alexgrover for his Dekidaka-Ashi indicator. His volume plots on candles were the inspiration for my top/bottom plots.
Kudos to PineCoders for their libraries. I use two of them in this script: Time and lower_tf .
The first versions of this script used functionality that I would not have known about were it not for these two guys:
— A guy called Kuan who commented on a Backtest Rookies presentation of their Volume Profile indicator.
— theheirophant , my partner in the exploration of the sometimes weird abysses of request.security() ’s behavior at lower timeframes.
Search in scripts for "Up down"

APEX - Aroon / Aroon Oscillator [v1]Simple Script that combines Aroon and Aroon Oscillator with MTF functionality for APEX.
Aroon
The Aroon also know as Aroon Up/Down will help you determine the trend of the asset of if the asset is ranging. The indicator consists of two lines the AroonDown and the Aroon Up.When Aroon Up reaches 100, a new uptrend may have begun. If it remains persistently between 70 and 100, and the Aroon-Down remains between 0 and 30, then a new uptrend is underway.If the Aroon-Up crosses above the Aroon-Down, then a new uptrend may start soon. Conversely, if Aroon-Down crosses above the Aroon-Up, then a new downtrend may start soon. When Aroon-Up reaches 100, a new uptrend may have begun. If it remains persistently between 70 and 100, and the Aroon-Down remains between 0 and 30, then a new uptrend is underway.
Aroon Oscillator
The Aroon Oscillator is the difference between Aroon-Up and Aroon-Down. These two indicators are usually plotted together for easy comparison, but chartists can also view the difference between these two indicators with the Aroon Oscillator. This indicator fluctuates between -100 and +100 with zero as the middle line. An upward trend bias is present when the oscillator is positive, while a downward trend bias exists when the oscillator is negative.

Kinetic Scalper [BULLBYTE]KINETIC SCALPER - ADVANCED MOMENTUM & CONFLUENCE TRADING SYSTEM
A SOPHISTICATED MULTI-FACTOR ANALYSIS INDICATOR FOR PRECISION ENTRIES
The Kinetic Scalper is a comprehensive trading analysis tool that combines volume-weighted momentum calculations, multi-oscillator divergence detection, and a proprietary 15-factor confluence scoring system to identify high-probability reversal setups across all timeframes.
WHAT MAKES THIS INDICATOR ORIGINAL
This is NOT a simple mashup of existing indicators.
The Kinetic Scalper features a completely custom momentum engine called the "Kinetic Pulse" - a volume-weighted momentum oscillator with Fisher Transform normalization that fundamentally differs from standard RSI or other momentum indicators. Every component feeds into a unified algorithmic framework designed specifically for this system.
KEY INNOVATIONS:
KINETIC PULSE ENGINE
Unlike standard RSI which uses simple price changes, the Kinetic Pulse applies:
→ Volume weighting to price movements (high-volume moves carry more weight)
→ EMA smoothing instead of traditional SMA (faster response to changes)
→ Fisher Transform normalization for improved signal clarity
→ Adaptive period adjustment based on current volatility regime
→ Result: A momentum oscillator that responds to conviction, not just price noise
15-FACTOR CONFLUENCE SCORING SYSTEM
Every signal is graded based on the number of confirming factors present:
→ Momentum position (oversold/overbought extremes)
→ Momentum velocity (direction change confirmation)
→ Momentum acceleration (strength of reversal)
→ Multi-oscillator divergence (price vs. 3 oscillators)
→ Volume confirmation (above-average participation)
→ Volume delta analysis (buying vs. selling pressure)
→ Higher timeframe alignment (trend confirmation from larger timeframe)
→ Session timing (major forex session awareness)
→ Structure clearance (clear path to profit targets)
→ Support/resistance proximity (confluence with key levels)
→ Market regime filtering (trending vs. choppy conditions)
Signals are graded A+, A, or B based on how many factors align:
• CONSERVATIVE MODE: A+ requires 12+ factors, A requires 9+, B requires 7+
• BALANCED MODE: A+ requires 10+ factors, A requires 7+, B requires 5+
• AGGRESSIVE MODE: A+ requires 8+ factors, A requires 5+, B requires 3+
TRADE ANALYSIS STATE MACHINE
A sophisticated monitoring system that tracks trade conditions in real-time using:
→ 5-state analysis framework (Factors Aligned / Positive Bias / Mixed Signals / Factors Weakening / Negative Bias)
→ Hysteresis-based transitions (different thresholds to enter vs. exit states)
→ Confidence smoothing with EMA (reduces noise, prevents flip-flopping)
→ Minimum commitment periods before state changes
→ Override logic for significant events (near TP/SL, momentum reversals)
→ Result: Stable, actionable guidance that doesn't change on every bar
INSTRUMENT-AWARE CALIBRATION
Automatically detects what you're trading and applies optimized parameters:
→ Forex Majors: Standard ATR, high session weight
→ Forex Crosses: Tighter stops, moderate session weight
→ Crypto: Wider stops (1.8x multiplier), reduced session weight (24/7 markets)
→ Indices: Moderate-wide stops, high session weight
→ Commodities: Moderate stops, moderate session weight
WHAT THIS INDICATOR DOES
The Kinetic Scalper is designed to identify high-confluence reversal opportunities by analyzing multiple dimensions of market behavior simultaneously.
CORE FUNCTIONS:
1. SIGNAL GENERATION
→ Identifies potential reversal points at oversold/overbought extremes
→ Confirms with multi-oscillator divergence detection
→ Validates with volume, higher timeframe, and structural analysis
→ Filters out low-probability setups automatically
→ Grades signals based on total confluence factors present
2. AUTOMATED TRADE TRACKING
→ Calculates structure-based or ATR-based stop loss levels
→ Projects take profit targets using risk-to-reward ratios
→ Monitors live position status (P/L, distance to targets, R-multiple)
→ Tracks TP1 and TP2 hits automatically
→ Displays outcome markers (TP HIT, PARTIAL WIN, STOPPED)
3. REAL-TIME CONDITION MONITORING
→ Analyzes 6 factor categories during active trades
→ Provides confidence scoring (0-100 scale)
→ Generates actionable guidance based on current market state
→ Alerts when conditions deteriorate or improve
→ Helps with trade management decisions
4. COMPREHENSIVE MARKET ANALYSIS
→ Session detection (Asian, London, New York, Overlap)
→ Volatility regime identification (Low, Normal, High, Extreme)
→ Trend state classification (Trending Up/Down, Ranging, Transitioning)
→ Volume analysis (relative volume and delta approximation)
→ Choppiness filtering (blocks signals in ranging markets)
WHY USE THIS INDICATOR
PROBLEM: Most momentum indicators generate too many false signals at extremes.
SOLUTION: The Kinetic Scalper requires MULTIPLE confirming factors before generating a signal, dramatically reducing noise and focusing on high-confluence setups.
ADVANTAGES:
✓ QUALITY OVER QUANTITY
→ Signal grading ensures you can filter for only the highest-quality setups
→ A+ signals have 10-12+ confirming factors aligned
→ Cooldown periods prevent over-trading the same move
✓ COMPLETE TRADE FRAMEWORK
→ Entry signals with confluence justification
→ Calculated stop loss based on market structure or ATR
→ Two profit targets with clear risk-to-reward ratios
→ Live trade monitoring with factor analysis
→ Outcome tracking and visual markers
✓ ADAPTIVE TO MARKET CONDITIONS
→ Volatility-based period adjustment for momentum calculations
→ Instrument-specific ATR multipliers
→ Session awareness for forex traders
→ Higher timeframe trend filtering
→ Automatic regime detection (trending vs. choppy)
✓ TRANSPARENT METHODOLOGY
→ Every input has detailed tooltips explaining its purpose
→ Signal tooltips show exactly why a signal was generated
→ Dashboard displays all relevant market conditions
→ Factor scores are visible during trades
→ No "black box" mystery calculations
✓ NON-REPAINTING & RELIABLE
→ All signals use barstate.isconfirmed (only on closed bars)
→ Higher timeframe data uses lookahead_off with historical offset
→ No future data access or repainting behavior
→ What you see is what you get - signals don't disappear or move
HOW THE INDICATOR WORKS
SIGNAL GENERATION PROCESS:
STEP 1: MOMENTUM ANALYSIS
The Kinetic Pulse engine calculates volume-weighted momentum:
→ Price changes are weighted by volume ratio vs. 20-bar average
→ High-volume moves have more influence on the oscillator
→ Gains and losses are smoothed using EMA (not SMA like RSI)
→ Fisher Transform is applied for normalization to 0-100 scale
→ Result: Momentum reading that emphasizes conviction, not noise
STEP 2: REVERSAL DETECTION
The indicator looks for potential reversal conditions:
→ Kinetic Pulse reaching oversold zone (below dynamic lower threshold)
→ Momentum velocity turning positive after being negative (for longs)
→ OR bullish divergence detected on multiple oscillators
→ Price making lower lows while oscillators make higher lows = divergence
STEP 3: MULTI-OSCILLATOR DIVERGENCE CONFIRMATION
Divergence is validated across three sources:
→ Kinetic Pulse divergence
→ CCI divergence
→ Stochastic divergence
→ Multiple oscillators confirming divergence increases signal reliability
STEP 4: CONFLUENCE FACTOR SCORING
The system evaluates all 15 possible confirming factors:
→ Momentum position: Is pulse oversold/overbought? (+0 to +2 points)
→ Momentum direction: Is velocity reversing? (+0 to +2 points)
→ Momentum acceleration: Is reversal strengthening? (+0 to +1 point)
→ Divergence count: How many oscillators show divergence? (+0 to +2 points)
→ Volume strength: Is volume above 1.3x average? (+0 to +1 point)
→ Volume delta: Is cumulative delta positive/negative? (+0 to +1 point)
→ HTF alignment: Does higher timeframe support direction? (+0 to +2 points)
→ Session timing: Is it a prime trading session? (+0 to +1 point)
→ Clear air: Is path to targets clear of obstacles? (+0 to +1 point)
→ Structure confluence: Are we near support/resistance? (+0 to +1 point)
→ Market regime: Is market trending, not choppy? (+0 to +1 point)
Total possible score: 15 points
Minimum for signal: 3-12 points depending on sensitivity mode
STEP 5: FILTER VALIDATION
Before generating a signal, additional checks are performed:
→ Volume must be above minimum threshold (if filter enabled)
→ Higher timeframe must not oppose the signal direction (if filter enabled)
→ Target path must be clear of major resistance/support (if filter enabled)
→ Volatility must not be EXTREME (blocks signals in chaos)
→ Risk-to-reward ratio must meet minimum requirement
→ Cooldown period must have elapsed since last signal
STEP 6: SIGNAL GRADING
If all filters pass, the signal is graded based on score:
→ A+ Grade: Highest confluence (8-12+ factors depending on sensitivity)
→ A Grade: High confluence (5-9+ factors)
→ B Grade: Moderate confluence (3-7+ factors)
Only graded signals (A+, A, or B) are displayed.
STEP 7: TRADE LEVEL CALCULATION
Stop loss and targets are calculated automatically:
STOP LOSS METHODS:
• Structure-Based: Uses recent swing low/high with ATR buffer, constrained by min/max ATR limits
• ATR-Based: Pure ATR multiplier with min/max constraints
• Fixed ATR: Simple ATR multiplier, no adjustments
TARGET CALCULATION:
• TP1: Entry ± (Stop Distance × Target 1 R:R)
• TP2: Entry ± (Stop Distance × Target 2 R:R)
• Default: TP1 at 1.0 R:R (1:1), TP2 at 2.0 R:R (1:2)
STEP 8: TRADE MONITORING
Once a signal is taken, the indicator tracks:
→ Current P/L in ticks and R-multiples
→ Distance to each target in ATR units
→ Distance to stop loss in ATR units
→ TP1 hit detection (marks with label, updates lines)
→ TP2 hit detection (closes trade, marks outcome)
→ Stop loss hit detection (closes trade, differentiates partial vs. full loss)
STEP 9: FACTOR ANALYSIS (DURING TRADES)
The Trade Analysis Panel monitors 6 key factor categories:
→ Momentum: Is momentum still aligned with trade direction? (-15 to +15 pts)
→ Position: Current R-multiple position (-12 to +12 pts)
→ Volume: Is volume still supportive? (-6 to +6 pts)
→ HTF Alignment: Does HTF still support trade? (-6 to +8 pts)
→ Target Proximity: How close are we to targets? (0 to +10 pts)
→ Stop Proximity: Are we dangerously close to stop? (-15 to +3 pts)
Raw scores are summed and smoothed using 5-bar EMA to create Confidence Score (0-100).
STEP 10: STATE MACHINE TRANSITIONS
Based on smoothed confidence, the system transitions between 5 states:
→ FACTORS ALIGNED (72+): Everything looks good
→ POSITIVE BIAS (58-72): Conditions favorable
→ MIXED SIGNALS (48-58): Neutral conditions
→ FACTORS WEAKENING (22-48): Concerning signals
→ NEGATIVE BIAS (<22): Poor conditions
Hysteresis prevents rapid flipping between states (different entry/exit thresholds).
RECOMMENDED TIMEFRAMES & INSTRUMENTS
TIMEFRAME VERSATILITY:
Despite the name "Scalper," this indicator works on ALL timeframes:
✓ LOWER TIMEFRAMES (1m - 15m)
→ Ideal for: Scalping and very short-term trades
→ Expect: More signals, faster trades, requires active monitoring
→ Best for: Forex majors, liquid crypto pairs
→ Tip: Use Conservative sensitivity to reduce noise
✓ MID TIMEFRAMES (15m - 1H)
→ Ideal for: Intraday trading and day trading
→ Expect: Moderate signal frequency, 1-4 hour trade duration
→ Best for: Forex, indices, major crypto
→ Tip: Balanced sensitivity works well here
✓ HIGHER TIMEFRAMES (4H - Daily)
→ Ideal for: Swing trading and position trading
→ Expect: Fewer signals, higher-quality setups, multi-day trades
→ Best for: All instruments
→ Tip: Can use Aggressive sensitivity for more opportunities
INSTRUMENT COMPATIBILITY:
✓ FOREX MAJORS (EUR/USD, GBP/USD, USD/JPY, etc.)
→ Auto-detected or manually select "Forex Major"
→ Session filtering is highly valuable here
→ London/NY overlap generates best signals
✓ FOREX CROSSES (EUR/GBP, AUD/NZD, etc.)
→ Auto-detected or manually select "Forex Cross"
→ Slightly tighter stops applied automatically
→ Session weight reduced vs. majors
✓ CRYPTOCURRENCIES (BTC, ETH, SOL, etc.)
→ Auto-detected or manually select "Crypto"
→ Wider stops (1.8x multiplier) due to volatility
→ Session filtering less relevant (24/7 markets)
→ Works well on both spot and perpetual futures
✓ INDICES (S&P 500, NASDAQ, DAX, etc.)
→ Auto-detected or manually select "Index"
→ Session opens (NY, London) are important
→ Moderate stop widths applied
✓ COMMODITIES (Gold, Silver, Oil, etc.)
→ Auto-detected or manually select "Commodity"
→ Moderate stops and session awareness
→ Works well on both spot and futures
VISUAL ELEMENTS EXPLAINED
SIGNAL MARKERS:
The indicator offers 3 display styles (choose in settings):
• PREMIUM STYLE (Default)
→ Signal appears below/above candles with connecting line
→ Background panel with grade badge (LONG , SHORT , etc.)
→ Entry price displayed
→ Direction arrow pointing to entry candle
→ Most informative, best for detailed analysis
• MINIMAL STYLE
→ Simple dot marker with grade text next to it
→ Clean, unobtrusive design
→ Best for mobile devices or cluttered charts
→ Less visual noise
• CLASSIC STYLE
→ Diamond marker with grade badge below/above
→ Traditional indicator aesthetic
→ Good balance between info and simplicity
ALL STYLES INCLUDE:
→ Signal tooltips with complete trade plan details
→ Grade display (A+, A, or B)
→ Color coding (bright colors for A+, standard for A/B)
SIGNAL TOOLTIP CONTENTS:
When you hover over any signal marker, you'll see:
→ Signal direction and grade
→ Confluence score (actual points vs. required)
→ Reason for signal (divergence type, reversal pattern)
→ Complete trade plan (Entry, Stop, TP1, TP2)
→ Risk in ticks
→ Risk-to-reward ratios
→ Market conditions at signal (Pulse value, HTF status, Volume, Session)
TRADE LEVEL LINES:
When Trade Tracking is enabled:
• ENTRY LINE (Yellow/Gold)
→ Solid horizontal line at entry price
→ Shaded zone around entry (±ATR buffer)
→ Label showing entry price
→ Extends 20-25 bars into future
• STOP LOSS LINE (Orange/Red)
→ Dashed line at stop level
→ Label showing stop price and distance in ticks
→ Turns dotted and changes color after TP1 hit (breakeven implied)
→ Deleted when trade closes
• TAKE PROFIT 1 LINE (Blue)
→ Dotted line at TP1 level
→ Label showing price and R:R ratio (e.g., "1:1.0")
→ Turns solid and changes to green when hit
→ Deleted after TP1 hit
• TAKE PROFIT 2 LINE (Blue)
→ Solid line at TP2 level
→ Label showing price and R:R ratio (e.g., "1:2.0")
→ This is the "full win" target
→ Deleted when trade closes
OUTCOME MARKERS:
When trade milestones are reached:
• - Green label appears when first target is touched
• - Green label when second target is touched (trade complete)
• - Red label if stop loss hit before any target
• - Orange label if TP1 hit but then stopped out
PREVIOUS DAY LEVELS:
If enabled (Show Previous Day Levels):
• PDH (Previous Day High) - Solid red/orange line
→ Label shows "PDH: "
→ Useful resistance reference for intraday trading
• PDL (Previous Day Low) - Solid green line
→ Label shows "PDL: "
→ Useful support reference for intraday trading
BACKGROUND TINTS:
Subtle background colors indicate states:
→ Light green tint: Active long position being tracked
→ Light red tint: Active short position being tracked
→ Light orange tint: Extreme volatility warning (signals blocked)
DASHBOARD GUIDE
The indicator features TWO dashboard panels:
━━━━━━━━━━━━━━━━━━━━━━━━━━━━━━━━━━━━━━━━━━━━━━━━━━━━━━━━━━━━━━━━━━━━━━━━━━━━━
MAIN DASHBOARD (Top Right by default)
━━━━━━━━━━━━━━━━━━━━━━━━━━━━━━━━━━━━━━━━━━━━━━━━━━━━━━━━━━━━━━━━━━━━━━━━━━━━━
WHEN NO TRADE IS ACTIVE:
→ Bias: Current market bias (BULLISH, BEARISH, NEUTRAL, LEAN LONG/SHORT)
→ Based on Kinetic Pulse position and velocity
→ Helps you understand overall momentum direction
→ Pulse: Current Kinetic Pulse value (0-100 scale)
→ <30 = Oversold (potential long setups developing)
→ >70 = Overbought (potential short setups developing)
→ 40-60 = Neutral zone
→ Volatility: Current volatility regime (LOW, NORMAL, HIGH, EXTREME)
→ Calculated from ATR ratio vs. 100-period average
→ EXTREME volatility blocks all signals (too chaotic)
→ Trend: Market state classification
→ TREND UP / TREND DOWN: ADX > 25, directional movement clear
→ RANGING: ADX < 20, choppy conditions
→ TRANSITIONING: ADX 20-25, developing conditions
→ VOLATILE: Extreme ATR regime
→ Session: Current forex session
→ ASIAN (00:00-08:00 UTC)
→ LONDON (07:00-16:00 UTC)
→ NEW YORK (13:00-22:00 UTC)
→ LDN/NY (13:00-16:00 UTC) - Overlap period, highest volatility
→ OFF-HOURS: Outside major sessions
→ Volume: Current volume vs. 20-bar average
→ Displayed as multiplier (e.g., "1.45x" = 45% above average)
→ Green if >1.3x (high volume, bullish for signal quality)
→ Red if <0.8x (low volume, bearish for signal quality)
→ HTF: Higher timeframe analysis status
→ BULLISH: HTF momentum supports longs
→ BEARISH: HTF momentum supports shorts
→ NEUTRAL: No clear HTF direction
→ Best Score: Highest confluence score currently available
→ Shows both long and short scores
→ Format: " / "
→ Example: "8/7 " means long score is 8, threshold is 7, long is leading
→ Helps you anticipate which direction might signal next
→ PDH/PDL: Previous day high and low prices
→ Quick reference for intraday support/resistance
WHEN TRADE IS ACTIVE:
→ Trade: Direction and grade (e.g., "LONG ")
→ Entry: Entry price of current trade
→ P/L: Current profit/loss
→ Shown in ticks and R-multiples
→ Format: "+45 | +0.75R" or "-20 | -0.35R"
→ Green when positive, red when negative
→ TP1: First target status
→ Shows price and distance if not hit
→ Shows "HIT" in green if reached
→ TP2: Second target price and distance
→ Stop: Stop loss price and current distance from stop
→ Bars: Number of bars since entry (trade duration)
━━━━━━━━━━━━━━━━━━━━━━━━━━━━━━━━━━━━━━━━━━━━━━━━━━━━━━━━━━━━━━━━━━━━━━━━━━━━━
TRADE ANALYSIS PANEL (Bottom Left by default)
━━━━━━━━━━━━━━━━━━━━━━━━━━━━━━━━━━━━━━━━━━━━━━━━━━━━━━━━━━━━━━━━━━━━━━━━━━━━━
This panel provides algorithmic analysis of market conditions. It does NOT provide investment advice or recommendations.
WHEN NO TRADE IS ACTIVE:
Shows scanning status and signal readiness:
→ Long/Short Readiness Gauges
→ Visual bar showing proximity to signal threshold
→ Score display (e.g., "8/7" means 8 points scored, 7 needed)
→ "RDY" indicator when threshold reached
→ Status Messages
→ "Scanning for setups..." - Normal scanning mode
→ "Long setup ready - cooldown: X bars" - Signal qualified but in cooldown
→ "Oversold conditions - watch for reversal" - Setup developing
→ "Choppy conditions detected" - Warning about market state
→ "Extreme volatility - signals blocked" - Safety filter active
WHEN TRADE IS ACTIVE:
Header shows current analysis state:
→ FACTORS ALIGNED (Green) - Everything looks good, confidence 72+
→ POSITIVE BIAS (Light Green) - Conditions favorable, confidence 58-72
→ MIXED SIGNALS (Blue) - Neutral conditions, confidence 48-58
→ FACTORS WEAKENING (Orange) - Concerning signals, confidence 22-48
→ NEGATIVE BIAS (Red) - Poor conditions, confidence <22
Confidence Score:
→ Displayed as percentage (0-100%)
→ Visual gauge (|||||.....)
→ Trend indicator (Rising, Falling, Stable)
→ Shows momentum of confidence change
Factor Breakdown (if enabled):
Shows 6 factor categories with individual scores:
→ Momentum: Is momentum aligned with trade? (-15 to +15 points)
→ Positive if velocity matches trade direction
→ Negative if momentum opposes trade
→ Position: Current R-multiple analysis (-12 to +12 points)
→ Positive if trade is in profit
→ Negative if underwater
→ Score increases as profit grows
→ Volume: Is volume supportive? (-6 to +6 points)
→ Positive if volume above average
→ Negative if volume weak
→ HTF Align: Higher timeframe status (-6 to +8 points)
→ Positive if HTF still supports trade direction
→ Negative if HTF turned against trade
→ Target: Proximity to profit targets (0 to +10 points)
→ Higher score when approaching targets
→ Bonus if TP1 already hit and near TP2
→ Stop Dist: Distance from stop loss (-15 to +3 points)
→ Negative if dangerously close to stop (<0.3 ATR)
→ Positive if well away from stop (>1.5 ATR)
Each factor shows:
• Score value with +/- indicator
• Trend symbol: + (improving), - (deteriorating), = (stable)
• Visual gauge
Guidance Messages:
→ "TARGET 2 APPROACHING" - TP2 within 0.3 ATR
→ "TARGET 1 APPROACHING" - TP1 within 0.3 ATR
→ "STOP PROXIMITY WARNING" - Stop within 0.3 ATR
→ "Factors aligned - Holding" - Positive state, stay in trade
→ "Conditions favorable" - Still looking good
→ "Conditions mixed - " - Neutral assessment
→ "Factors deteriorating" - Warning of weakening setup
→ "Confluence weakening - secure gains" - Consider exit if profitable
COMPACT MODE (Mobile-Friendly):
→ Reduces panel size by showing only essential info
→ Factor icons instead of full breakdowns
→ Simplified guidance messages
→ Perfect for smaller screens
SETTINGS GUIDE
MASTER SETTINGS:
Instrument Type
→ Purpose: Optimizes ATR multipliers and session weights for your asset
→ Options: Auto-Detect (recommended), Forex Major, Forex Cross, Crypto, Index, Commodity
→ Default: Auto-Detect
→ When to change: If auto-detection is incorrect for your symbol
Signal Sensitivity
→ Purpose: Controls how many factors required before generating signals
→ Options:
• Conservative: Requires 12+ for A+, 9+ for A, 7+ for B (fewer, highest quality)
• Balanced: Requires 10+ for A+, 7+ for A, 5+ for B (recommended)
• Aggressive: Requires 8+ for A+, 5+ for A, 3+ for B (more frequent)
→ Default: Balanced
→ When to change: If you want fewer signals (Conservative) or more opportunities (Aggressive)
Enable Trade Signals
→ Purpose: Master on/off switch for signal generation
→ Default: ON
→ When to disable: If you only want to use the analysis dashboards without signals
Enable Trade Tracking
→ Purpose: Tracks active trades and monitors conditions until TP/SL hit
→ Default: ON
→ When to disable: If you manage trades manually and don't want automatic tracking
Show Entry/Stop/Target Levels
→ Purpose: Displays trade plan lines and labels on chart
→ Default: ON
→ When to disable: If you prefer clean charts or manage levels yourself
DISPLAY SETTINGS:
Color Theme
→ Purpose: Optimizes colors for your chart background
→ Options: Dark (for dark charts), Light (for light charts)
→ Default: Dark
Signal Display Style
→ Purpose: Visual style of signal markers
→ Options:
• Premium: Badge with line and background panel (most detailed)
• Minimal: Simple dot with grade text (cleanest)
• Classic: Diamond marker with badge (traditional)
→ Default: Premium
Signal Distance
→ Purpose: How far signal labels appear from price bars (in ATR units)
→ Range: 0.5 to 10.0
→ Default: 2.0
→ When to adjust: Increase to 3.0-4.0 if signals hide behind candle wicks
TP/SL Label Distance
→ Purpose: Spacing of price labels to prevent overlap
→ Range: 0.5 to 5.0
→ Default: 1.5
Show Previous Day Levels
→ Purpose: Display PDH/PDL reference lines
→ Default: ON
→ Best for: Intraday traders who respect previous day levels
MAIN DASHBOARD:
Show Main Dashboard
→ Purpose: Toggle visibility of market conditions table
→ Default: ON
Main Dashboard Position
→ Options: Top Right, Top Left, Bottom Right, Bottom Left
→ Default: Top Right
→ When to change: To avoid overlap with TradingView's built-in panels
TRADE ANALYSIS PANEL:
Show Trade Analysis Panel
→ Purpose: Toggle factor analysis dashboard
→ Default: ON
Analysis Panel Position
→ Options: Top Right, Top Left, Bottom Right, Bottom Left, Middle Right, Middle Left
→ Default: Bottom Left
→ Recommended: Bottom Right or Middle Right to avoid overlap with Main Dashboard
Compact Mode
→ Purpose: Reduces panel size for mobile or smaller screens
→ Default: OFF
→ When to enable: Mobile trading, small screens, or minimalist preference
Show Factor Details
→ Purpose: Displays individual factor scores vs. overall confidence only
→ Default: ON
→ When to disable: For more compact view showing only state and confidence
RISK MANAGEMENT:
Stop Loss Method
→ Purpose: How stop loss distance is calculated
→ Options:
• Structure-Based: Uses swing highs/lows with ATR buffer (recommended)
• ATR-Based: Pure ATR multiplier with min/max constraints
• Fixed ATR: Simple multiplier, no adjustments
→ Default: Structure-Based
→ Impact: Structure-Based respects market geometry but constrains within safe limits
ATR Stop Multiplier
→ Purpose: Multiplier for ATR-based stop calculation
→ Range: 0.5 to 3.0
→ Default: 1.5
→ When to adjust:
• Increase to 2.0-2.5 for more breathing room (fewer false stops)
• Decrease to 1.0-1.2 for tighter stops (but more stop-outs)
Maximum Stop Distance (ATR)
→ Purpose: Cap on stop width to prevent excessive risk
→ Range: 1.0 to 5.0
→ Default: 2.5
→ Impact: If structure-based stop exceeds this, ATR-based stop is used instead
Minimum Stop Distance (ATR)
→ Purpose: Floor on stop width to avoid noise-induced stops
→ Range: 0.2 to 1.0
→ Default: 0.5
→ Impact: Prevents stops too tight to survive normal volatility
Target 1 Risk/Reward Ratio
→ Purpose: R:R for first profit target
→ Range: 0.5 to 2.0
→ Default: 1.0 (1:1 ratio)
→ Common values: 1.0 for quick profit taking, 1.5 for patient trading
Target 2 Risk/Reward Ratio
→ Purpose: R:R for second profit target (full win)
→ Range: 1.0 to 4.0
→ Default: 2.0 (1:2 ratio)
→ Common values: 2.0-3.0 for balanced risk/reward
Minimum R:R Required
→ Purpose: Filters out signals with poor risk/reward
→ Range: 0.5 to 2.0
→ Default: 1.0
→ Impact: Signals where potential reward doesn't meet this ratio are rejected
→ WARNING: Always ensure your position sizing means a stop loss = no more than 1-2% of your account, regardless of R:R ratio
SIGNAL FILTERS:
Session Awareness
→ Purpose: Weights signals higher during major forex sessions
→ Default: ON
→ Impact: Doesn't block signals, but session quality factors into scoring
→ Best for: Forex traders
Session Timezone
→ Purpose: Timezone for session calculations
→ Options: UTC, America/New_York, Europe/London, Asia/Tokyo, Asia/Hong_Kong
→ Default: UTC
→ When to change: Match your broker's server time
Higher Timeframe Alignment
→ Purpose: Checks HTF momentum before generating signals
→ Default: ON
→ Impact: Filters counter-trend signals, improves quality
→ Recommended: Keep enabled
HTF Timeframe
→ Purpose: Which higher timeframe to check
→ Default: Auto (blank field)
→ Auto selection:
• 1m chart → 5m HTF
• 5m chart → 15m HTF
• 15m chart → 1H HTF
• 1H chart → 4H HTF
• 4H+ chart → Daily HTF
→ Manual override: Enter any timeframe (e.g., "60" for 1-hour)
Volume Confirmation
→ Purpose: Requires above-average volume for signals
→ Default: ON
→ Impact: Filters low-liquidity false signals
→ Recommended: Keep enabled
Minimum Volume Ratio
→ Purpose: Volume threshold vs. 20-bar average
→ Range: 0.3 to 2.0
→ Default: 0.8 (80% of average)
→ When to adjust:
• Increase to 1.2-1.5 for only high-volume signals
• Decrease to 0.5-0.7 for more permissive filtering
Structure Clearance Check
→ Purpose: Ensures clear path to targets (no nearby resistance/support)
→ Default: ON
→ Impact: Prevents trades with immediate obstacles
→ Recommended: Keep enabled
Minimum Bars Between Signals
→ Purpose: Cooldown period after each signal
→ Range: 1 to 10
→ Default: 3
→ Impact: After a signal, this many bars must pass before another in same direction
→ When to adjust:
• Increase to 5-7 to prevent over-trading
• Decrease to 1-2 for faster re-entries
ADVANCED TUNING:
Momentum Period
→ Purpose: Base period for Kinetic Pulse calculation
→ Range: 5 to 30
→ Default: 14
→ When to adjust:
• Lower (8-10): More responsive, noisier
• Higher (18-21): Smoother, slower to react
→ Note: If Adaptive Period enabled, this is adjusted automatically
Adaptive Period
→ Purpose: Auto-adjusts momentum period based on volatility
→ Default: ON
→ Impact: Shortens period in high volatility, lengthens in low volatility
→ Recommended: Keep enabled for automatic optimization
Divergence Lookback
→ Purpose: How far back to search for divergence patterns
→ Range: 10 to 60
→ Default: 30
→ When to adjust:
• Shorter (15-20): Only recent divergences
• Longer (40-50): Catches older divergences (may be less relevant)
Swing Detection Bars
→ Purpose: Bars required on each side to confirm swing high/low
→ Range: 2 to 7
→ Default: 3
→ Impact on stops:
• Lower (2-3): More swing points, potentially tighter stops
• Higher (5-7): Only major swings, wider stops
Choppiness Index Threshold
→ Purpose: Threshold above which market considered choppy
→ Range: 38.2 to 80.0
→ Default: 61.8
→ Impact:
• Lower (50-55): Stricter quality filter (fewer signals in ranging markets)
• Higher (65-70): More permissive (allows signals in choppier conditions)
HOW TO READ SIGNALS
SIGNAL ANATOMY:
When a signal appears, you'll see:
1. DIRECTIONAL MARKER
→ Arrow, dot, or diamond pointing to entry candle (depends on style)
→ Positioned below price for LONG, above price for SHORT
→ Connected to price with line (Premium style)
2. GRADE BADGE
→ Displays signal quality: LONG , SHORT , etc.
→ Color coding:
• Bright green/cyan for A+ longs
• Standard green for A/B longs
• Bright pink/magenta for A+ shorts
• Standard red for A/B shorts
3. ENTRY PRICE (Premium style only)
→ Shows exact entry price at signal generation
4. TOOLTIP (all styles)
→ Hover over signal to see complete trade plan
→ Includes: Entry, Stop, TP1, TP2, Risk, R:R ratios, market conditions, signal reason, confluence score
INTERPRETING GRADES:
→ A+ SIGNALS (Highest Quality)
• 8-12+ confirming factors aligned
• Multiple divergences OR strong momentum reversal
• HTF alignment + volume + session timing + clear structure
• These are your highest-probability setups
• Recommended action: Give these priority, consider larger position size
→ A SIGNALS (High Quality)
• 5-9+ confirming factors aligned
• Good confluence, most key factors present
• Missing 1-2 optimal conditions
• These are still quality trades
• Recommended action: Standard position size, solid setups
→ B SIGNALS (Moderate Quality)
• 3-7+ confirming factors aligned
• Minimum viable confluence
• May be missing HTF alignment, volume, or session timing
• Higher variance outcomes
• Recommended action: Smaller position size or skip if conservative
SIGNAL NARRATIVE:
Each signal tooltip includes a narrative explaining WHY it was generated:
→ "Multi-divergence at oversold extreme"
• Multiple oscillators showing bullish divergence
• Kinetic Pulse in oversold zone
• High-quality reversal setup
→ "Bullish divergence near support"
• Divergence detected
• Price near key support level (swing low or PDL)
• Structure confluence
→ "Momentum reversal with HTF alignment"
• Kinetic Pulse velocity reversing
• Higher timeframe supports direction
• Strong trend-following setup
→ "Oversold momentum reversal"
• Extreme Kinetic Pulse reading reversing
• May not have divergence but strong momentum shift
READING THE TRADE PLAN:
Every signal comes with a complete trade plan:
→ ENTRY: The close price of the signal candle
• This is where the signal triggered
• If using limit orders, you might improve on this price
→ STOP: Calculated stop loss level
• Based on your Stop Loss Method setting
• Distance shown in ticks
• Risk tolerance: Ensure this represents ≤1-2% of your account
→ TP1: First profit target
• Default: 1:1 risk-reward
• This is your partial profit or first exit
• Consider taking 50% off at TP1
→ TP2: Second profit target
• Default: 1:2 risk-reward
• This is your "full win" target
• Hold remaining position for this level
SIGNAL FREQUENCY EXPECTATIONS:
Frequency varies by timeframe, sensitivity, and market conditions:
→ AGGRESSIVE MODE
• Lower timeframes (1m-5m): 5-15 signals per day
• Mid timeframes (15m-1H): 2-5 signals per day
• Higher timeframes (4H-D): 1-3 signals per week
→ BALANCED MODE (Default)
• Lower timeframes: 3-8 signals per day
• Mid timeframes: 1-3 signals per day
• Higher timeframes: 2-5 signals per week
→ CONSERVATIVE MODE
• Lower timeframes: 1-4 signals per day
• Mid timeframes: 0-2 signals per day
• Higher timeframes: 1-3 signals per week
Note: Frequency also depends on market volatility and trending vs. ranging conditions.
Example - Kinetic Scalper Trade Sequence
Here's an example showing the complete trade lifecycle with all dashboard transitions, annotations, and descriptions.
INSTRUMENT & TIMEFRAME DETAILS
Symbol: Nifty 50 Index (NSE)
Date: December 15, 2025
Session: London session (active trading hours)
Instrument Type: Index (auto-detected)
TRADE SEQUENCE BREAKDOWN
SCREENSHOT 1: Pre-Signal Setup Building (Image 1)
Time: ~12:00-14:30 UTC+5:30(approx.)
Price Action: Uptrend showing signs of exhaustion near 26,200
Market State: Price at session highs
Main Dashboard (Top Right):
- Bias: LEAN SHORT
- Pulse: 58.9 (approaching overbought)
- Volatility: NORMAL
- Trend: TRANSITIONING
- Session: LONDON (favorable timing)
- Volume: 0.98x (slightly below average)
- HTF: BULLISH (caution for counter-trend)
- Best Score: 9/5 (Short score building)
- PDH/PDL: 26098.25 / 25938.95
Trade Analysis Panel (Bottom Left):
- Status: NO ACTIVE TRADE
- Long Score: 5/5 (RDY)
- Short Score: 9/5 (RDY)
- Panel Message: "Short pattern developing - score: 9"
Description :
Setup Development Phase: The indicator identifies a potential short opportunity as price reaches the previous day's high. The short confluence score has climbed to 9/15 points, meeting the 'Balanced' sensitivity threshold for a Grade B signal. Notice the 'LEAN SHORT' bias and the Kinetic Pulse reading of 58.9 approaching overbought territory. The Trade Analysis panel shows 'Short pattern developing' with 9/5 factors aligned. Key factors: momentum approaching reversal zone, price at resistance (PDH), and London session providing favorable conditions.
SCREENSHOT 2: Signal Generated & Trade Entered (Image 2)
Time: ~13:00 UTC+5:30 (signal bar)
Entry Price: 26,184.65
Signal Grade: Grade
Main Dashboard (Top Right):
- Trade: SHORT
- Entry: 26184.65
- P/L: 5.95 pts | +0.2R (early positive movement)
- TP1: 26157.00 (33.2 pts away)
- TP2: 26129.35 (60.84 pts away)
- Stop: 26212.30 (22.1 pts away)
- Bars: 1 (just entered)
Trade Analysis Panel (Bottom Left):
- Header: TRADE ANALYSIS
- Status Bar: "Conditions mixed - improving 57%"
- Confidence: 57% RISING
- Factor Breakdown:
- Momentum: -4 (velocity not yet aligned)
- Position: +4 (slight profit)
- Volume: +2 = (volume present)
- HTF Align: +2 = (not strongly aligned)
- Target: +0 - (far from TP)
- Stop Dist: +3 - (good distance)
- Bottom Status: "Conditions mixed - Monitoring"
- Disclaimer: "Analysis only - Not financial advice"
Description:
Signal Activation: A Grade A short signal triggers at 26,184.65 after the short confluence score reached qualifying levels. The indicator places a structure-based stop loss at 26,212.30 (27.65 points risk) with dual targets at 1:1 and 1:2 risk-reward ratios.
The Trade Analysis Panel immediately begins monitoring with an initial confidence score of 57% - classified as 'MIXED SIGNALS' but showing a 'RISING' trend. Factor analysis reveals: momentum not yet aligned (-4 points as price just reversed), position slightly favorable (+4 points already +0.2R), volume adequate (+2), HTF showing weak alignment (+2 as we're counter-trend), stop well-placed (+3), but targets still distant (0 points).
Notice how the Main Dashboard switches from market scanning mode to active trade tracking, now displaying entry price, live P/L in both points (5.95 pts) and R-multiples (+0.2R), and distances to all key levels. The analysis panel provides real-time factor scoring to help monitor trade health.
SCREENSHOT 3: TP1 Hit - Trade Performing Well (Image 3)
Time: ~14:20 UTC+5:30(approx)
Price: ~26,154 (TP1 zone)
Bars in Trade: 29
Main Dashboard (Top Right):
- Trade: SHORT
- Entry: 26184.65
- P/L: 30.85 pts | +1.12R (excellent progress)
- TP1: HIT (displayed in green)
- TP2: 26129.35 (24.44 pts away)
- Stop: 26212.30 (58.5 pts away - well protected)
- Bars: 29
Trade Analysis Panel (Bottom Left):
- Header: TRADE ANALYSIS
- Status Bar: "Multiple factors positive"
- Confidence: 78% RISING
- Factor Breakdown:
- Momentum: +8 = (ALIGNED)
- Position: +8 + (strong profit zone)
- Volume: +2 + (continued support)
- HTF Align: +8 = (now strongly aligned)
- Target: +10 + (TP1 achieved, approaching TP2)
- Stop Dist: +3 + (excellent cushion)
- Bottom Status: "Multiple factors positive"
- Visual State: Green background (FACTORS ALIGNED state)
Description:
Trade Execution Phase - First Target Achieved: After 29 bars , price reaches the first take-profit target at 26,157.00. The ' ' marker confirms partial profit taking. Current P/L shows +30.85 points (+1.12R), exceeding the initial 1:1 risk-reward.
The Trade Analysis Panel shows dramatic improvement - confidence has surged to 78% (FACTORS ALIGNED state) with most factors now positive:
- Momentum factor improved to +8 (velocity aligned with trade direction)
- Position factor at +8 (over +1R profit zone)
- HTF Align jumped to +8 (higher timeframe now confirming the move)
- Target factor maxed at +10 (TP1 achieved, TP2 within reach)
- Stop Distance at +3 (58.5 points cushion providing safety)
Notice the panel status displays 'Multiple factors positive' with a green-tinted background, indicating optimal trade conditions. The confidence trend shows 'RISING' suggesting continued momentum. With TP1 secured and only 24.44 points to TP2, the trade is well-positioned for a full 1:2R win.
SCREENSHOT 4: TP2 Reached - Trade Complete (Image 4)
Time: ~15:00+ UTC+5:30
Final Exit: 26,129.35 (TP2)
Final Result: Full TP2 win
Main Dashboard (Top Right):
- Bias: NEUTRAL (reverted to scanning mode)
- Pulse: 45.2 (returned to neutral zone)
- Volatility: NORMAL
- Trend: TREND DOWN (confirmed the move)
- Session: LONDON
- Volume: 1.26x (increased as move developed)
- HTF: BEARISH (fully aligned post-trade)
- Best Score: 5/5 (neutral after completion)
Trade Analysis Panel (Bottom Left):
- Status: NO ACTIVE TRADE (reverted)
- Long Score: 5/5 (RDY)
- Short Score: 5/5 (RDY)
- Panel Message: "Scanning - prime session active"
- Light blue/cyan background (back to scanning mode)
Description:
Trade Completion - Full Target Achieved: The short trade reaches its second take-profit target at 26,129.35, securing a complete 1:2 risk-reward win. The ' ' marker confirms the exit. Final results:
- Entry: 26,184.65
- Exit: 26,129.35
- Profit: 55.30 points (approximately +2.0R)
- Outcome: Full TP2 success
Post-Trade Analysis: After trade closure, the indicator automatically returns to market scanning mode. The Main Dashboard reverts to showing market conditions rather than trade metrics. Notice how the 'Trend' now displays 'TREND DOWN' - confirming the move we captured. Volume increased to 1.26x during the winning move, validating the signal quality.
The Trade Analysis Panel switches back to 'NO ACTIVE TRADE' status and resumes displaying long/short setup scores. The confidence-based factor monitoring was instrumental throughout the trade:
- Initial entry at 57% confidence (MIXED SIGNALS)
- Peak confidence of 78% at TP1 (FACTORS ALIGNED)
- Real-time factor updates helped confirm trade validity
This example demonstrates the indicator's complete workflow: setup identification → signal generation → entry execution → live trade monitoring → systematic exit at targets.
KEY FEATURES DEMONSTRATED
1. Dual Dashboard System
- Main Dashboard: Market conditions (scanning) → Trade metrics (active position)
- Analysis Panel: Setup scores (scanning) → Factor-based confidence (in-trade)
2. Visual Trade Management
- Color-coded entry zones (yellow)
- Risk levels clearly marked (red dashed stop)
- Profit targets with R:R ratios labeled
- Achievement markers ( , )
3. Real-Time Factor Analysis
- 6-factor scoring system (Momentum, Position, Volume, HTF, Target, Stop Dist)
- Confidence percentage with trend indicators
- State machine (MIXED → FACTORS ALIGNED)
- Hysteresis prevents false state changes
4. Risk Management
- Structure-based stop placement (respects swing highs)
- Multiple take-profit levels (1:1 and 1:2 R:R)
- Live P/L tracking in points and R-multiples
- Distance monitoring to all key levels
This complete example showcases the indicator's progression from setup identification through trade completion, demonstrating how the dual-dashboard system and factor-based analysis provide continuous trade guidance. The structured stop-loss and dual-target approach delivered the planned 1:2 risk-reward ratio with systematic, rule-based execution.
ALERT SYSTEM
The indicator includes 9 built-in alert conditions:
SIGNAL ALERTS:
→ High-Grade Long Signal (A+)
• Triggers only on A+ long signals
• For traders who want only the highest-quality longs
• Message: "KINETIC SCALPER: LONG @ "
→ High-Grade Short Signal (A+)
• Triggers only on A+ short signals
• For traders who want only the highest-quality shorts
• Message: "KINETIC SCALPER: SHORT @ "
→ Long Signal
• Triggers on ANY qualified long signal (A+, A, or B)
• For traders who want all long opportunities
• Message: "KINETIC SCALPER: LONG @ "
→ Short Signal
• Triggers on ANY qualified short signal
• For traders who want all short opportunities
• Message: "KINETIC SCALPER: SHORT @ "
TRADE MANAGEMENT ALERTS:
→ TP1 Hit
• Triggers when first profit target is reached
• Useful for partial profit taking notifications
• Message: "KINETIC SCALPER: TP1 REACHED"
→ TP2 Reached
• Triggers when second profit target is reached
• Trade is complete, full win achieved
• Message: "KINETIC SCALPER: TP2 REACHED"
→ Stop Loss Hit
• Triggers when stop loss is reached
• Important for trade management and risk tracking
• Message: "KINETIC SCALPER: STOP LOSS"
ANALYSIS STATE ALERTS:
→ Analysis State: Negative Bias
• Triggers when factor analysis enters "Negative Bias" state
• Warning that trade conditions are deteriorating
• Consider reducing position or preparing to exit
• Message: "KINETIC SCALPER: Analysis state changed to NEGATIVE BIAS"
→ Analysis State: Factors Weakening
• Triggers when factor analysis enters "Factors Weakening" state
• Caution that confluence is diminishing
• Monitor trade closely
• Message: "KINETIC SCALPER: Analysis state changed to FACTORS WEAKENING"
HOW TO SET UP ALERTS:
1. Click the "Create Alert" button in TradingView
2. Condition: Select "Kinetic Scalper "
3. Choose your desired alert from the dropdown
4. Configure your alert options:
→ Once Per Bar Close (recommended for non-repainting)
→ Frequency: Once Per Bar Close or Only Once
5. Set expiration and notification methods (popup, email, webhook, etc.)
6. Create alert
RECOMMENDED ALERT STRATEGY:
For active traders:
→ Set "Long Signal" and "Short Signal" alerts for all opportunities
→ Set "TP1 Hit", "TP2 Reached", and "Stop Loss Hit" for trade management
→ Consider "Analysis State: Negative Bias" for trade monitoring
For selective traders:
→ Set only "High-Grade Long Signal (A+)" and "High-Grade Short Signal (A+)"
→ Focus on the absolute highest-quality setups
→ Set TP/SL alerts for position management
USAGE TIPS & BEST PRACTICES
SIGNAL SELECTION:
✓ GRADE MATTERS
→ A+ signals have statistically more confluence factors
→ If you're conservative, trade only A+ signals
→ B signals can work but require more discretion
✓ CONFLUENCE WITH YOUR ANALYSIS
→ Use this indicator as CONFIRMATION, not sole decision criteria
→ Combine with your own support/resistance analysis
→ Check for fundamental events (news, economic data)
→ Respect major round numbers and psychological levels
✓ SESSION TIMING (Forex)
→ Best signals often occur during London/NY overlap
→ Avoid signals 10 minutes before major news releases
→ Asian session signals can be valid but lower liquidity
✓ TIMEFRAME CONFLUENCE
→ If you get an A+ signal on 15m, check if 1H chart agrees
→ Higher timeframe confirmation adds conviction
→ Avoid signals that oppose the daily/4H trend
TRADE MANAGEMENT:
✓ POSITION SIZING
→ ALWAYS size positions so stop loss = 1-2% of account
→ Never risk more than you can afford to lose
→ Smaller position on B signals, standard on A, larger on A+ (within limits)
✓ PARTIAL PROFIT TAKING
→ Consider taking 50% off at TP1
→ Move stop to breakeven after TP1 hit
→ Let remaining position run to TP2
✓ TRAILING STOPS
→ The indicator doesn't auto-trail stops (manual decision)
→ After TP1, you might manually move stop to entry (breakeven)
→ Consider ATR-based trailing stop for runners
✓ WATCH THE ANALYSIS PANEL
→ If state changes to "Factors Weakening" while in profit, consider exit
→ "Negative Bias" during a trade is a strong warning
→ "Factors Aligned" confirms your trade thesis is still valid
RISK MANAGEMENT:
✓ NEVER IGNORE STOPS
→ The calculated stop is there for a reason
→ Moving stop further away increases risk exponentially
→ If stopped out, accept it and wait for next setup
✓ AVOID REVENGE TRADING
→ If you get stopped out, resist urge to immediately re-enter
→ Signal cooldown helps with this
→ Wait for next qualified signal
✓ RESPECT VOLATILITY WARNINGS
→ If indicator shows "EXTREME" volatility, signals are blocked for a reason
→ Don't force trades in chaotic conditions
→ Wait for regime to normalize
✓ CORRELATION RISK
→ Be aware of correlation if trading multiple pairs
→ EUR/USD and GBP/USD are highly correlated
→ Don't stack risk on correlated instruments
OPTIMIZATION:
✓ START WITH DEFAULTS
→ Default settings are well-tested
→ Don't over-optimize for recent market behavior
→ Give settings at least 20-30 trades before judging
✓ TIMEFRAME-SPECIFIC ADJUSTMENTS
→ Lower timeframes: Consider increasing Signal Distance to 3.0-4.0
→ Higher timeframes: ATR Stop Multiplier might go to 2.0-2.5
→ Crypto: Ensure Instrument Type is set to "Crypto" for proper stops
✓ SENSITIVITY CALIBRATION
→ Too many signals? Switch to Conservative
→ Missing good setups? Try Balanced or Aggressive
→ Quality > Quantity always
✓ KEEP A JOURNAL
→ Track which signal grades work best for you
→ Note which sessions produce best results
→ Review stopped trades for patterns
THINGS TO AVOID:
✗ DON'T chase signals after several bars have passed
✗ DON'T ignore the stop loss or move it further away
✗ DON'T overtrade by taking every B-grade signal
✗ DON'T trade during major news if you're not experienced
✗ DON'T use this as your only analysis tool
✗ DON'T expect 100% win rate (no indicator has this)
✗ DON'T risk more than 1-2% per trade regardless of signal grade
UNDERSTANDING THE METHODOLOGY
WHY VOLUME WEIGHTING?
Traditional momentum oscillators treat all price moves equally. A 10-point move on low volume is weighted the same as a 10-point move on high volume.
The Kinetic Pulse corrects this by:
→ Calculating volume ratio vs. 20-bar average
→ Applying square root transformation to volume ratio (prevents extreme weights)
→ Multiplying price changes by volume weight
→ Result: High-volume moves influence the oscillator more than low-volume noise
This helps filter false breakouts and emphasizes moves with participation.
WHY FISHER TRANSFORM?
Fisher Transform is a mathematical transformation that:
→ Normalizes probability distributions
→ Creates sharper turning points
→ Amplifies extremes while compressing the middle
→ Makes overbought/oversold levels more distinct
Applied to the Kinetic Pulse, it helps identify genuine extremes vs. noise.
WHY MULTI-OSCILLATOR DIVERGENCE?
Single-source divergence can give false signals. By requiring divergence confirmation across multiple oscillators (Kinetic Pulse, CCI, Stochastic), the system filters out:
→ Divergences caused by calculation quirks in one oscillator
→ Temporary momentum anomalies
→ False divergence on noisy, low-timeframe charts
Multiple sources confirming the same pattern increases reliability.
WHY ADAPTIVE PERIODS?
Fixed periods can be:
→ Too slow during high volatility (miss fast reversals)
→ Too fast during low volatility (generate noise)
The adaptive system:
→ Shortens period when ATR ratio > 1.3 (high volatility = need faster response)
→ Lengthens period when ATR ratio < 0.7 (low volatility = need noise filtering)
→ Keeps period in reasonable range (60% to 140% of base period)
→ Result: Oscillator adjusts to current market pace automatically
WHY HYSTERESIS IN STATE MACHINE?
Without hysteresis, the analysis state would flip-flop on every bar, creating:
→ Confusing, contradictory guidance
→ Analysis paralysis
→ Lack of actionable information
Hysteresis solves this by:
→ Using different thresholds to ENTER vs. EXIT a state
→ Example: Enter "Factors Aligned" at 72+ confidence, but don't exit until <62
→ This creates stable states that persist through minor fluctuations
→ Requires minimum commitment period (3 bars) before state changes
→ Overrides commitment for significant events (near TP/SL)
→ Result: Stable, trustworthy analysis that changes only when truly warranted
WHY CONFIDENCE SMOOTHING?
Raw factor scores fluctuate bar-by-bar based on momentary conditions. Smoothing:
→ Uses 5-period EMA on raw confidence scores
→ Filters out single-bar anomalies
→ Preserves genuine trends in confidence
→ Prevents false state transitions
→ Result: More reliable assessment of actual trade health
WHY INSTRUMENT-SPECIFIC PARAMETERS?
Different instruments have different characteristics:
→ Forex is highly liquid, respects technical levels well, standard ATR works
→ Crypto is extremely volatile, needs wider stops (1.8x) to avoid false stops
→ Indices respect session opens strongly, session weighting is important
→ Commodities fall in between
Auto-detection applies research-based multipliers automatically.
WHY STRUCTURE-BASED STOPS?
ATR-based stops can:
→ Place stop in middle of consolidation (easily hit)
→ Ignore obvious invalidation levels
→ Be too tight during expansion or too wide during contraction
Structure-based stops:
→ Use actual swing highs/lows (where traders actually place stops)
→ Add small ATR buffer to avoid stop hunting
→ Constrain within min/max ATR limits for safety
→ Result: Stops that respect market geometry while managing risk
DISCLAIMER & RISK WARNING
READ THIS CAREFULLY BEFORE USING THIS INDICATOR
This indicator is provided for EDUCATIONAL and INFORMATIONAL purposes only.
❌ NOT FINANCIAL ADVICE
This indicator does NOT constitute financial advice, investment recommendations, or solicitation to buy or sell any financial instrument. All information is for educational purposes only.
❌ NO GUARANTEES
→ Past performance does NOT guarantee future results
→ No indicator can predict future price movements with certainty
→ Signal grades represent confluence, NOT win probability
→ A+ signals can lose, B signals can win - markets are probabilistic
❌ SUBSTANTIAL RISK
Trading financial instruments involves SUBSTANTIAL RISK of loss:
→ You can lose your entire investment
→ Leveraged trading amplifies both gains AND losses
→ Never trade with money you cannot afford to lose
→ Never risk more than 1-2% of your account per trade
❌ YOUR RESPONSIBILITY
→ All trading decisions are YOUR responsibility
→ You must conduct your own analysis before entering trades
→ Consult a licensed financial advisor before trading
→ Understand the risks specific to your jurisdiction and situation
→ Only trade with capital you can afford to lose completely
❌ NO HOLY GRAIL
→ This indicator is a TOOL, not a complete trading system
→ It should be used as part of a broader analysis framework
→ Combine with your own technical analysis, risk management, and judgment
→ No indicator works 100% of the time in all market conditions
❌ ANALYSIS PANEL DISCLAIMER
The "Trade Analysis Panel" provides ALGORITHMIC ANALYSIS of market factors.
→ It does NOT provide investment advice or recommendations
→ Factor scores are mathematical calculations, not predictions
→ Guidance messages are informational, not directives
→ All trading decisions remain your responsibility
❌ BACKTESTING LIMITATIONS
→ This is an indicator, not a strategy, so no backtesting results are provided
→ Any backtesting you perform includes hindsight bias and optimization bias
→ Historical performance does not indicate future performance
→ Slippage, commissions, and real-world execution differ from backtests
❌ MARKET CONDITIONS
→ This indicator performs differently in trending vs. ranging markets
→ Extreme volatility can produce false signals or whipsaws
→ Low liquidity periods increase execution risk
→ Major news events can invalidate technical analysis
BY USING THIS INDICATOR, YOU ACKNOWLEDGE:
→ You have read and understood this disclaimer
→ You accept full responsibility for your trading decisions
→ You understand the substantial risks involved in trading
→ You will not hold the author liable for any losses incurred
→ You are using this tool as part of your own due diligence process
KEY FEATURES SUMMARY
✅ Volume-Weighted Kinetic Pulse Engine (proprietary momentum calculation)
✅ 15-Factor Confluence Scoring System (graded signals: A+, A, B)
✅ Multi-Oscillator Divergence Detection (Pulse + CCI + Stochastic)
✅ Higher Timeframe Trend Alignment Filter
✅ Adaptive Period Adjustment (volatility-responsive)
✅ Instrument-Aware Calibration (Forex, Crypto, Indices, Commodities)
✅ Structure-Based Stop Loss Calculation (respects swing highs/lows)
✅ Automated Trade Tracking (entry, stop, TP1, TP2, P/L)
✅ Real-Time Factor Analysis State Machine (5-state system with hysteresis)
✅ Session Awareness (Asian, London, New York, Overlap)
✅ Volatility Regime Detection (blocks signals in extreme conditions)
✅ Choppiness Filter (reduces signals in ranging markets)
✅ Volume Confirmation (relative volume and delta analysis)
✅ Clean Air Check (validates clear path to targets)
✅ Comprehensive Dashboards (market conditions + trade analysis)
✅ Customizable Display (3 signal styles, color themes, positioning)
✅ 9 Built-In Alert Conditions (signals, TP/SL hits, state changes)
✅ Fully Non-Repainting (barstate.isconfirmed, lookahead_off)
✅ Previous Day Levels (PDH/PDL reference lines)
✅ Mobile-Friendly Compact Mode (for smaller screens)
TECHNICAL SPECIFICATIONS
→ Pine Script Version: v6
→ Indicator Type: Overlay (displays on price chart)
→ License: Mozilla Public License 2.0
→ Copyright: BULLBYTE
→ Object Limits: 300 labels, 100 lines, 50 boxes
→ Memory Management: Automatic cleanup system (FIFO queue)
→ Repainting: Non-repainting (signals confirmed on bar close)
→ Timeframe Support: All timeframes (1s to Monthly)
→ Instrument Support: Forex, Crypto, Indices, Commodities, Stocks
→ HTF Data Handling: lookahead_off with historical offset
VERSION HISTORY
v1.0 - Initial Release
→ Kinetic Pulse engine with volume weighting and Fisher Transform
→ 15-factor confluence scoring system
→ Trade analysis state machine with hysteresis
→ Automated trade tracking and monitoring
→ Dual dashboard system (market conditions + factor analysis)
→ 9 alert conditions
→ 3 signal display styles
→ Instrument-aware calibration
→ Full risk management framework
WHO IS THIS INDICATOR FOR?
IDEAL FOR:
✓ Scalpers and day traders seeking high-confluence reversal entries
✓ Swing traders who want quality over quantity
✓ Traders who appreciate systematic, rules-based analysis
✓ Multi-timeframe traders who value HTF confirmation
✓ Forex traders who respect session timing
✓ Crypto traders needing volatility-adjusted parameters
✓ Traders who want complete trade management (entry, stop, targets)
✓ Analytical traders who want transparency in signal generation
NOT IDEAL FOR:
✗ Traders seeking a "set and forget" holy grail system
✗ Traders who don't want to learn the methodology
✗ Traders unwilling to accept losing trades as part of the process
✗ Traders who need constant signals (this is a quality-focused system)
✗ Traders who ignore risk management
FINAL THOUGHTS
The Kinetic Scalper is the result of extensive research into momentum behavior, volume confirmation, and multi-factor confluence analysis. It's designed to identify high-probability reversal setups while maintaining strict risk management and providing complete transparency.
This is NOT a magic solution. It's a sophisticated TOOL that requires:
→ Understanding of the methodology
→ Proper risk management discipline
→ Patience to wait for quality setups
→ Willingness to accept losses as part of trading
→ Integration with your own analysis and judgment
Used properly as part of a complete trading plan, the Kinetic Scalper can help you identify high-confluence opportunities and manage trades systematically.
Remember: Quality over quantity. Discipline over emotion. Risk management over everything.
Trade smart. Trade safe.
© 2025 BULLBYTE | Kinetic Scalper v1.0 | For Educational Purposes Only

Market Regime# MARKET REGIME IDENTIFICATION & TRADING SYSTEM
## Complete User Guide
---
## 📋 TABLE OF CONTENTS
1. (#overview)
2. (#regimes)
3. (#indicator-usage)
4. (#entry-signals)
5. (#exit-signals)
6. (#regime-strategies)
7. (#confluence)
8. (#backtesting)
9. (#optimization)
10. (#examples)
---
## OVERVIEW
### What This System Does
This is a **complete market regime identification and trading system** that:
1. **Identifies 6 distinct market regimes** automatically
2. **Adapts trading tactics** to each regime
3. **Provides high-probability entry signals** with confluence scoring
4. **Shows optimal exit points** for each trade
5. **Can be backtested** to validate performance
### Two Components Provided
1. **Indicator** (`market_regime_indicator.pine`)
- Visual regime identification
- Entry/exit signals on chart
- Dynamic support/resistance
- Info tables with live data
- Use for manual trading
2. **Strategy** (`market_regime_strategy.pine`)
- Fully automated backtestable version
- Same logic as indicator
- Position sizing and risk management
- Performance metrics
- Use for backtesting and automation
---
## THE 6 MARKET REGIMES
### 1. 🟢 BULL TRENDING
**Characteristics:**
- Strong uptrend
- Price above SMA50 and SMA200
- ADX > 25 (strong trend)
- Higher highs and higher lows
- DI+ > DI- (bullish momentum)
**What It Means:**
- Market has clear upward direction
- Buyers in control
- Pullbacks are buying opportunities
- Strongest regime for long positions
**How to Trade:**
- ✅ **BUY dips to EMA20 or SMA20**
- ✅ Enter when RSI < 60 on pullback
- ✅ Hold through minor corrections
- ❌ Don't short against the trend
- ❌ Don't sell too early
**Expected Behavior:**
- Pullbacks are shallow (5-10%)
- Bounces are strong
- Support at moving averages holds
- Volume increases on rallies
---
### 2. 🔴 BEAR TRENDING
**Characteristics:**
- Strong downtrend
- Price below SMA50 and SMA200
- ADX > 25 (strong trend)
- Lower highs and lower lows
- DI- > DI+ (bearish momentum)
**What It Means:**
- Market has clear downward direction
- Sellers in control
- Rallies are selling opportunities
- Strongest regime for short positions
**How to Trade:**
- ✅ **SELL rallies to EMA20 or SMA20**
- ✅ Enter when RSI > 40 on bounce
- ✅ Hold through minor bounces
- ❌ Don't buy against the trend
- ❌ Don't cover shorts too early
**Expected Behavior:**
- Rallies are weak (5-10%)
- Selloffs are strong
- Resistance at moving averages holds
- Volume increases on declines
---
### 3. 🔵 BULL RANGING
**Characteristics:**
- Bullish bias but consolidating
- Price near or above SMA50
- ADX < 20 (weak trend)
- Trading in range
- Choppy price action
**What It Means:**
- Uptrend is pausing
- Accumulation phase
- Support and resistance zones clear
- Lower volatility
**How to Trade:**
- ✅ **BUY at support zone**
- ✅ Enter when RSI < 40
- ✅ Take profits at resistance
- ⚠️ Smaller position sizes
- ⚠️ Tighter stops
**Expected Behavior:**
- Range-bound oscillations
- Support bounces repeatedly
- Resistance rejections common
- Eventually breaks higher (usually)
---
### 4. 🟠 BEAR RANGING
**Characteristics:**
- Bearish bias but consolidating
- Price near or below SMA50
- ADX < 20 (weak trend)
- Trading in range
- Choppy price action
**What It Means:**
- Downtrend is pausing
- Distribution phase
- Support and resistance zones clear
- Lower volatility
**How to Trade:**
- ✅ **SELL at resistance zone**
- ✅ Enter when RSI > 60
- ✅ Take profits at support
- ⚠️ Smaller position sizes
- ⚠️ Tighter stops
**Expected Behavior:**
- Range-bound oscillations
- Resistance holds repeatedly
- Support bounces are weak
- Eventually breaks lower (usually)
---
### 5. ⚪ CONSOLIDATION
**Characteristics:**
- No clear direction
- Range compression
- Very low ADX (< 15 often)
- Price inside tight range
- Neutral sentiment
**What It Means:**
- Market is coiling
- Building energy for next move
- Indecision between buyers/sellers
- Calm before the storm
**How to Trade:**
- ✅ **WAIT for breakout direction**
- ✅ Enter on high-volume breakout
- ✅ Direction becomes clear
- ❌ Don't trade inside the range
- ❌ Avoid choppy scalping
**Expected Behavior:**
- Narrow range
- Low volume
- False breakouts possible
- Explosive move when it breaks
---
### 6. 🟣 CHAOS (High Volatility)
**Characteristics:**
- Extreme volatility
- No clear direction
- Erratic price swings
- ATR > 2x average
- Unpredictable
**What It Means:**
- Market panic or euphoria
- News-driven moves
- Emotion dominates logic
- Highest risk environment
**How to Trade:**
- ❌ **STAY OUT!**
- ❌ No positions
- ❌ Wait for stability
- ✅ Protect existing positions
- ✅ Reduce risk
**Expected Behavior:**
- Large intraday swings
- Gaps up/down
- Stop hunts
- Whipsaws
- Eventually calms down
---
## INDICATOR USAGE
### Visual Elements
#### 1. Background Colors
- **Light Green** = Bull Trending (go long)
- **Light Red** = Bear Trending (go short)
- **Light Teal** = Bull Ranging (buy dips)
- **Light Orange** = Bear Ranging (sell rallies)
- **Light Gray** = Consolidation (wait)
- **Purple** = Chaos (stay out!)
#### 2. Regime Labels
- Appear when regime changes
- Show new regime name
- Positioned at highs (bullish) or lows (bearish)
#### 3. Entry Signals
- **Green "LONG"** labels = Buy here
- **Red "SHORT"** labels = Sell here
- Number shows confluence score (X/5 signals)
- Hover for details (stop, target, RSI, etc.)
#### 4. Exit Signals
- **Orange "EXIT LONG"** = Close long position
- **Orange "EXIT SHORT"** = Close short position
- Shows exit reason in tooltip
#### 5. Support/Resistance Lines
- **Green line** = Dynamic support (buy zone)
- **Red line** = Dynamic resistance (sell zone)
- Adapts to regime automatically
#### 6. Moving Averages
- **Blue** = SMA 20 (short-term trend)
- **Orange** = SMA 50 (medium-term trend)
- **Purple** = SMA 200 (long-term trend)
### Information Tables
#### Top Right Table (Main Info)
Shows real-time market conditions:
- **Current Regime** - What regime we're in
- **Bias** - Long, Short, Breakout, or Stay Out
- **ADX** - Trend strength (>25 = strong)
- **Trend** - Strong, Moderate, or Weak
- **Volatility** - High or Normal
- **Vol Ratio** - Current vs average volatility
- **RSI** - Momentum (>70 overbought, <30 oversold)
- **vs SMA50/200** - Price position relative to MAs
- **Support/Resistance** - Exact price levels
- **Long/Short Signals** - Confluence scores (X/5)
#### Bottom Right Table (Regime Guide)
Quick reference for each regime:
- What action to take
- What strategy to use
- Color-coded for quick identification
---
## ENTRY SIGNALS EXPLAINED
### Confluence Scoring System (5 Factors)
Each entry signal is scored 0-5 based on how many factors align:
#### For LONG Entries:
1. ✅ **Regime Alignment** - In Bull Trending or Bull Ranging
2. ✅ **RSI Pullback** - RSI between 35-50 (not overbought)
3. ✅ **Near Support** - Price within 2% of dynamic support
4. ✅ **MACD Turning Up** - Momentum shifting bullish
5. ✅ **Volume Confirmation** - Above average volume
#### For SHORT Entries:
1. ✅ **Regime Alignment** - In Bear Trending or Bear Ranging
2. ✅ **RSI Rejection** - RSI between 50-65 (not oversold)
3. ✅ **Near Resistance** - Price within 2% of dynamic resistance
4. ✅ **MACD Turning Down** - Momentum shifting bearish
5. ✅ **Volume Confirmation** - Above average volume
### Confluence Requirements
**Minimum Confluence** (default = 2):
- 2/5 = Entry signal triggered
- 3/5 = Good signal
- 4/5 = Strong signal
- 5/5 = Excellent signal (rare)
**Higher confluence = Higher probability = Better trades**
### Specific Entry Patterns
#### 1. Bull Trending Entry
```
Requirements:
- Regime = Bull Trending
- Price pulls back to EMA20
- Close above EMA20 (bounce)
- Up candle (close > open)
- RSI < 60
- Confluence ≥ 2
```
#### 2. Bear Trending Entry
```
Requirements:
- Regime = Bear Trending
- Price rallies to EMA20
- Close below EMA20 (rejection)
- Down candle (close < open)
- RSI > 40
- Confluence ≥ 2
```
#### 3. Bull Ranging Entry
```
Requirements:
- Regime = Bull Ranging
- RSI < 40 (oversold)
- Price at or below support
- Up candle (reversal)
- Confluence ≥ 1 (more lenient)
```
#### 4. Bear Ranging Entry
```
Requirements:
- Regime = Bear Ranging
- RSI > 60 (overbought)
- Price at or above resistance
- Down candle (rejection)
- Confluence ≥ 1 (more lenient)
```
#### 5. Consolidation Breakout
```
Requirements:
- Regime = Consolidation
- Price breaks above/below range
- Volume > 1.5x average (explosive)
- Strong directional candle
```
---
## EXIT SIGNALS EXPLAINED
### Three Types of Exits
#### 1. Regime Change Exits (Automatic)
- **Long Exit**: Regime changes to Bear Trending or Chaos
- **Short Exit**: Regime changes to Bull Trending or Chaos
- **Reason**: Market character changed, strategy no longer valid
#### 2. Support/Resistance Break Exits
- **Long Exit**: Price breaks below support by 2%
- **Short Exit**: Price breaks above resistance by 2%
- **Reason**: Key level violated, trend may be reversing
#### 3. Momentum Exits
- **Long Exit**: RSI > 70 (overbought) AND down candle
- **Short Exit**: RSI < 30 (oversold) AND up candle
- **Reason**: Overextension, take profits
### Stop Loss & Take Profit
**Stop Loss** (Automatic in strategy):
- Placed at Entry - (ATR × 2)
- Adapts to volatility
- Protected from whipsaws
- Typically 2-4% for stocks, 5-10% for crypto
**Take Profit** (Automatic in strategy):
- Placed at Entry + (Stop Distance × R:R Ratio)
- Default 2.5:1 reward:risk
- Example: $2 risk = $5 reward target
- Allows winners to run
---
## TRADING EACH REGIME
### BULL TRENDING - Most Profitable Long Environment
**Strategy: Buy Every Dip**
**Entry Rules:**
1. Wait for pullback to EMA20 or SMA20
2. Look for RSI < 60
3. Enter when candle closes above MA
4. Confluence should be 2+
**Stop Loss:**
- Below the recent swing low
- Or 2 × ATR below entry
**Take Profit:**
- At previous high
- Or 2.5:1 R:R minimum
**Position Size:**
- Can use full size (2% risk)
- High win rate regime
**Example Trade:**
```
Price: $100, pulls back to $98 (EMA20)
Entry: $98.50 (close above EMA)
Stop: $96.50 (2 ATR)
Target: $103.50 (2.5:1)
Risk: $2, Reward: $5
```
---
### BEAR TRENDING - Most Profitable Short Environment
**Strategy: Sell Every Rally**
**Entry Rules:**
1. Wait for bounce to EMA20 or SMA20
2. Look for RSI > 40
3. Enter when candle closes below MA
4. Confluence should be 2+
**Stop Loss:**
- Above the recent swing high
- Or 2 × ATR above entry
**Take Profit:**
- At previous low
- Or 2.5:1 R:R minimum
**Position Size:**
- Can use full size (2% risk)
- High win rate regime
**Example Trade:**
```
Price: $100, rallies to $102 (EMA20)
Entry: $101.50 (close below EMA)
Stop: $103.50 (2 ATR)
Target: $96.50 (2.5:1)
Risk: $2, Reward: $5
```
---
### BULL RANGING - Buy Low, Sell High
**Strategy: Range Trading (Long Bias)**
**Entry Rules:**
1. Wait for price at support zone
2. Look for RSI < 40
3. Enter on reversal candle
4. Confluence should be 1-2+
**Stop Loss:**
- Below support zone
- Tighter than trending (1.5 ATR)
**Take Profit:**
- At resistance zone
- Don't hold through resistance
**Position Size:**
- Reduce to 1-1.5% risk
- Lower win rate than trending
**Example Trade:**
```
Range: $95-$105
Entry: $96 (at support, RSI 35)
Stop: $94 (below support)
Target: $104 (at resistance)
Risk: $2, Reward: $8 (4:1)
```
---
### BEAR RANGING - Sell High, Buy Low
**Strategy: Range Trading (Short Bias)**
**Entry Rules:**
1. Wait for price at resistance zone
2. Look for RSI > 60
3. Enter on rejection candle
4. Confluence should be 1-2+
**Stop Loss:**
- Above resistance zone
- Tighter than trending (1.5 ATR)
**Take Profit:**
- At support zone
- Don't hold through support
**Position Size:**
- Reduce to 1-1.5% risk
- Lower win rate than trending
**Example Trade:**
```
Range: $95-$105
Entry: $104 (at resistance, RSI 65)
Stop: $106 (above resistance)
Target: $96 (at support)
Risk: $2, Reward: $8 (4:1)
```
---
### CONSOLIDATION - Wait for Breakout
**Strategy: Breakout Trading**
**Entry Rules:**
1. Identify consolidation range
2. Wait for VOLUME SURGE (1.5x+ avg)
3. Enter on close outside range
4. Direction must be clear
**Stop Loss:**
- Opposite side of range
- Or 2 ATR
**Take Profit:**
- Measure range height, project it
- Example: $10 range = $10 move expected
**Position Size:**
- Reduce to 1% risk
- 50% false breakout rate
**Example Trade:**
```
Consolidation: $98-$102 (4-point range)
Breakout: $102.50 (high volume)
Entry: $103
Stop: $100 (back in range)
Target: $107 (4-point range projected)
Risk: $3, Reward: $4
```
---
### CHAOS - STAY OUT!
**Strategy: Preservation**
**What to Do:**
- ❌ NO new positions
- ✅ Close existing positions if near entry
- ✅ Tighten stops on profitable trades
- ✅ Reduce position sizes dramatically
- ✅ Wait for regime to stabilize
**Why It's Dangerous:**
- Stop hunts are common
- Whipsaws everywhere
- News-driven volatility
- No technical reliability
- Even "perfect" setups fail
**When Does It End:**
- Volatility ratio drops < 1.5
- ADX starts rising (direction appears)
- Price respects support/resistance again
- Usually 1-5 days
---
## CONFLUENCE SYSTEM
### How It Works
The system scores each potential entry on 5 factors. More factors aligning = higher probability.
### Confluence Requirements by Regime
**Trending Regimes** (strictest):
- Minimum 2/5 required
- 3/5 = Good
- 4-5/5 = Excellent
**Ranging Regimes** (moderate):
- Minimum 1-2/5 required
- 2/5 = Good
- 3+/5 = Excellent
**Consolidation** (breakout only):
- Volume is most critical
- Direction confirmation
- Less confluence needed
### Adjusting Minimum Confluence
**If too few signals:**
- Lower from 2 to 1
- More trades, lower quality
**If too many false signals:**
- Raise from 2 to 3
- Fewer trades, higher quality
**Recommendation:**
- Start at 2
- Adjust based on win rate
- Aim for 55-65% win rate
---
## STRATEGY BACKTESTING
### Loading the Strategy
1. Copy `market_regime_strategy.pine`
2. Open Pine Editor in TradingView
3. Paste and "Add to Chart"
4. Strategy Tester tab opens at bottom
### Initial Settings
```
Risk Per Trade: 2%
ATR Stop Multiplier: 2.0
Reward:Risk Ratio: 2.5
Trade Longs: ✓
Trade Shorts: ✓
Trade Trending Only: ✗ (test both)
Avoid Chaos: ✓
Minimum Confluence: 2
```
### What to Look For
**Good Results:**
- Win Rate: 50-60%
- Profit Factor: 1.8-2.5
- Net Profit: Positive
- Max Drawdown: <20%
- Consistent equity curve
**Warning Signs:**
- Win Rate: <45% (too many losses)
- Profit Factor: <1.5 (barely profitable)
- Max Drawdown: >30% (too risky)
- Erratic equity curve (unstable)
### Testing Different Regimes
**Test 1: Trending Only**
```
Trade Trending Only: ✓
Result: Higher win rate, fewer trades
```
**Test 2: All Regimes**
```
Trade Trending Only: ✗
Result: More trades, potentially lower win rate
```
**Test 3: Long Only**
```
Trade Longs: ✓
Trade Shorts: ✗
Result: Works in bull markets
```
**Test 4: Short Only**
```
Trade Longs: ✗
Trade Shorts: ✓
Result: Works in bear markets
```
---
## SETTINGS OPTIMIZATION
### Key Parameters to Adjust
#### 1. Risk Per Trade (Most Important)
- **0.5%** = Very conservative
- **1.0%** = Conservative (recommended for beginners)
- **2.0%** = Moderate (recommended)
- **3.0%** = Aggressive
- **5.0%** = Very aggressive (not recommended)
**Impact:** Higher risk = higher returns BUT bigger drawdowns
#### 2. Reward:Risk Ratio
- **2:1** = More wins needed, hit target faster
- **2.5:1** = Balanced (recommended)
- **3:1** = Fewer wins needed, hold longer
- **4:1** = Very patient, best in trending
**Impact:** Higher R:R = can have lower win rate
#### 3. Minimum Confluence
- **1** = More signals, lower quality
- **2** = Balanced (recommended)
- **3** = Fewer signals, higher quality
- **4** = Very selective
- **5** = Almost never triggers
**Impact:** Higher = fewer but better trades
#### 4. ADX Thresholds
- **Trending: 20-30** (default 25)
- Lower = detect trends earlier
- Higher = only strong trends
- **Ranging: 15-25** (default 20)
- Lower = identify ranging earlier
- Higher = only weak trends
#### 5. Trend Period (SMA)
- **20-50** = Short-term trends
- **50** = Medium-term (default, recommended)
- **100-200** = Long-term trends
**Impact:** Longer period = slower regime changes, more stable
### Optimization Workflow
**Step 1: Baseline**
- Use all default settings
- Test on 3+ years
- Record: Win Rate, PF, Drawdown
**Step 2: Risk Optimization**
- Test 1%, 1.5%, 2%, 2.5%
- Find best risk-adjusted return
- Balance profit vs drawdown
**Step 3: R:R Optimization**
- Test 2:1, 2.5:1, 3:1
- Check which maximizes profit factor
- Consider holding time
**Step 4: Confluence Optimization**
- Test 1, 2, 3
- Find sweet spot for win rate
- Aim for 55-65% win rate
**Step 5: Regime Filter**
- Test with/without trend filter
- Test with/without chaos filter
- Find what works for your asset
---
## REAL TRADING EXAMPLES
### Example 1: Bull Trending - SPY
**Setup:**
- Regime: BULL TRENDING
- Price pulls back from $450 to $445
- EMA20 at $444
- RSI drops to 45
- Confluence: 4/5
**Entry:**
- Price closes at $445.50 (above EMA20)
- LONG signal appears
- Enter at $445.50
**Risk Management:**
- Stop: $443 (2 ATR = $2.50)
- Target: $451.75 (2.5:1 = $6.25)
- Risk: $2.50 per share
- Position: 80 shares (2% of $10k = $200 risk)
**Outcome:**
- Price rallies to $452 in 3 days
- Target hit
- Profit: $6.50 × 80 = $520
- Return: 2.6 × risk (excellent)
---
### Example 2: Bear Ranging - AAPL
**Setup:**
- Regime: BEAR RANGING
- Range: $165-$175
- Price rallies to $174
- Resistance at $175
- RSI at 68
- Confluence: 3/5
**Entry:**
- Rejection candle at $174
- SHORT signal appears
- Enter at $173.50
**Risk Management:**
- Stop: $176 (above resistance)
- Target: $166 (support)
- Risk: $2.50
- Position: 80 shares
**Outcome:**
- Price drops to $167 in 2 days
- Target hit
- Profit: $6.50 × 80 = $520
- Return: 2.6 × risk
---
### Example 3: Consolidation Breakout - BTC
**Setup:**
- Regime: CONSOLIDATION
- Range: $28,000 - $30,000
- Compressed for 2 weeks
- Volume declining
**Breakout:**
- Price breaks $30,000
- Volume surges 200%
- Close at $30,500
- LONG signal
**Entry:**
- Enter at $30,500
**Risk Management:**
- Stop: $29,500 (back in range)
- Target: $32,000 (range height = $2k)
- Risk: $1,000
- Position: 0.2 BTC ($200 risk on $10k)
**Outcome:**
- Price runs to $33,000
- Target exceeded
- Profit: $2,500 × 0.2 = $500
- Return: 2.5 × risk
---
### Example 4: Avoiding Chaos - Tesla
**Setup:**
- Regime: BULL TRENDING
- LONG position from $240
- Elon tweets something crazy
- Regime changes to CHAOS
**Action:**
- EXIT signal appears
- Close position immediately
- Current price: $242 (small profit)
**Outcome:**
- Next 3 days: wild swings
- High $255, Low $230
- By staying out, avoided:
- Potential stop out
- Whipsaw losses
- Stress
**Result:**
- Small profit preserved
- Capital protected
- Re-enter when regime stabilizes
---
## ALERTS SETUP
### Available Alerts
1. **Bull Trending Regime** - Market goes bullish
2. **Bear Trending Regime** - Market goes bearish
3. **Chaos Regime** - High volatility, stay out
4. **Long Entry Signal** - Buy opportunity
5. **Short Entry Signal** - Sell opportunity
6. **Long Exit Signal** - Close long
7. **Short Exit Signal** - Close short
### How to Set Up
1. Click **⏰ (Alert)** icon in TradingView
2. Select **Condition**: Choose indicator + alert type
3. **Options**: Popup, Email, Webhook, etc.
4. **Message**: Customize notification
5. Click **Create**
### Recommended Alert Strategy
**For Active Traders:**
- Long Entry Signal
- Short Entry Signal
- Long Exit Signal
- Short Exit Signal
**For Position Traders:**
- Bull Trending Regime (enter longs)
- Bear Trending Regime (enter shorts)
- Chaos Regime (exit all)
**For Conservative:**
- Only regime change alerts
- Manually review entries
- More selective
---
## TIPS FOR SUCCESS
### 1. Start Small
- Paper trade first
- Then 0.5% risk
- Build to 1-2% over time
### 2. Follow the Regime
- Don't fight it
- Adapt your style
- Different tactics for each
### 3. Trust the Confluence
- 4-5/5 = Best trades
- 2-3/5 = Good trades
- 1/5 = Skip unless desperate
### 4. Respect Exits
- Don't hope and hold
- Cut losses quickly
- Take profits at targets
### 5. Avoid Chaos
- Seriously, just stay out
- Protect your capital
- Wait for clarity
### 6. Keep a Journal
- Record every trade
- Note regime and confluence
- Review weekly
- Learn patterns
### 7. Backtest Thoroughly
- 3+ years minimum
- Multiple market conditions
- Different assets
- Walk-forward test
### 8. Be Patient
- Best setups are rare
- 1-3 trades per week is normal
- Quality over quantity
- Compound over time
---
## COMMON QUESTIONS
**Q: How many trades per month should I expect?**
A: Depends on timeframe and settings. Daily chart: 5-15 trades/month. 4H chart: 15-30 trades/month.
**Q: What's a good win rate?**
A: 55-65% is excellent. 50-55% is good. Below 50% needs adjustment.
**Q: Should I trade all regimes?**
A: Beginners: Only trending. Intermediate: Trending + ranging. Advanced: All except chaos.
**Q: Can I use this on any timeframe?**
A: Best on Daily and 4H. Works on 1H with more noise. Not recommended <1H.
**Q: What if I'm in a trade and regime changes?**
A: Exit immediately (if using indicator) or let strategy handle it automatically.
**Q: How do I know if I'm over-optimizing?**
A: If results are perfect on one period but fail on another. Use walk-forward testing.
**Q: Should I always take 5/5 confluence trades?**
A: Yes, but they're rare (1-2/month). Don't wait only for these.
**Q: Can I combine this with other indicators?**
A: Yes, but keep it simple. RSI, MACD already included. Maybe add volume profile.
**Q: What assets work best?**
A: Liquid stocks, major crypto, futures. Avoid forex spot (use futures), penny stocks.
**Q: How long to hold positions?**
A: Trending: Days to weeks. Ranging: Hours to days. Breakout: Days. Let the regime guide you.
---
## FINAL THOUGHTS
This system gives you:
- ✅ Clear market context (regime)
- ✅ High-probability entries (confluence)
- ✅ Defined exits (automatic signals)
- ✅ Adaptable tactics (regime-specific)
- ✅ Backtestable results (strategy version)
**Success requires:**
- 📚 Understanding each regime
- 🎯 Following the signals
- 💪 Discipline to wait
- 🧠 Emotional control
- 📊 Proper risk management
**Start your journey:**
1. Load the indicator
2. Watch for 1 week (no trading)
3. Identify regime patterns
4. Paper trade for 1 month
5. Go live with small size
6. Scale up as you gain confidence
**Remember:** The market will always be here. There's no rush. Master one regime at a time, and you'll be profitable in all conditions!
Good luck! 🚀

Trinity Real Move Detector DashboardRelease Notes (critical)
1. This code "will" require tweaks for different timeframes to the multiplier, do not assume the data in the table is accurate, cross check it with the Trinity Real Move Detector or another ATR tool, to validate the values in the table and ensure you have set the correct values.
2. I mention this below. But please understand that pine code has a limitation in the number of security calls (40 request.security() calls per script). This code is on the limit of that threshold and I would encourage developers to see if they can find a way around this to improve the script and release further updates.
What do we have...
The Trinity Real Move Detector Dashboard is a powerful TradingView indicator designed to scan multiple assets at once and show when each one has genuine short-term volatility "energy" — the kind that makes directional options trades (especially 0DTE or short-dated) have a high probability of follow-through, and can be used for swing trading as well. It combines a simple ATR-based volatility filter with a SuperTrend-style bias to tell you not only if the market is "awake" but also in which direction the momentum is leaning.
At its core, the indicator calculates the current ATR on your chosen timeframe and compares it to a user-defined percentage of the asset's daily ATR. When the short-term ATR spikes above that threshold, it signals "enough energy" — meaning the underlying is moving with real force rather than choppy noise. The SuperTrend logic then determines bullish or bearish bias, so the status shows "BULLISH ENERGY" (green) or "BEARISH ENERGY" (red) when energy is on, or "WAIT" when it's not. It also counts how many bars the energy has been active and shows the current ATR vs threshold for quick visual confirmation.
The dashboard displays all this in a clean table with columns for Symbol, Multiplier, Current ATR, Threshold, Status, Bars Active, and Bias (UP/DOWN). It's perfect for 3-minute charts but works on any timeframe — just adjust the multiplier based on the hints in the settings.
Editing symbols and multipliers is straightforward and user-friendly. In the indicator settings, you'll see numbered inputs like "1. Symbol - NVDA" and "1. Multiplier". To change an asset, simply type the new ticker in the symbol field (e.g., replace "NVDA" with "TSLA", "AVGO", or "ADAUSD"). You can also adjust the multiplier for each asset individually in the corresponding "Multiplier" field to make it more or less sensitive — lower numbers give more signals, higher numbers give stricter, higher-quality ones. This lets you customize the dashboard to your watchlist without any coding. For example, if you switch to a 4-hour chart or a slower-moving stock like AVGO, you may need to raise the multiplier (e.g., to 0.3–0.4) to avoid false "bullish" signals during minor bounces in a larger downtrend.
One important note about the multiplier and timeframes: the default values are optimized for fast intraday charts (like 3-minute or 5-minute). On higher timeframes (15-minute, 1-hour, 4-hour, or daily), the SuperTrend bias can be too sensitive with low multipliers (1.0 default in the code), leading to situations like the AVGO 4-hour example — where price is clearly downtrending, but the dashboard shows "BULLISH ENERGY" because the tight bands flip on small bounces. To fix this, you need to manually increase the multiplier for that asset (or all assets) in the settings. For 4-hour or daily charts, 0.25–0.35 is often better to match smoother SuperTrend indicators like Trinity. Always test on your timeframe and asset — crypto usually needs slightly lower multipliers than stocks due to higher volatility.
TradingView has a hard limit of 40 request.security() calls per script. Each asset in the dashboard requires several calls (current ATR, daily ATR, SuperTrend components, etc.), so with the full ATR-based bias, you can safely monitor about 6–8 assets before hitting the limit. Adding more symbols increases the number of calls and will trigger the "too many securities" error. This is a platform restriction to prevent excessive server load, and there's no official way around it in a single script. Some advanced coders use tricks like caching or lower-timeframe requests to squeeze in a few more, but for reliability, sticking to 6–8 assets is recommended. If you need more, the common workaround is to create two separate indicators (e.g., one for stocks, one for crypto) and add both to the same chart.
Overall, this dashboard gives you a professional-grade multi-asset scanner that filters out low-energy noise and highlights real momentum opportunities across stocks and crypto — all in one glance. It's especially valuable for options traders who want to avoid theta decay on weak moves and only strike when the market has true fuel. By tweaking the per-symbol multipliers in the settings, you can perfectly adapt it to any timeframe or asset behavior, avoiding issues like the AVGO false bullish signal on higher timeframes.

EMA Slope Angle# EMA Slope Angle Indicator
A professional, non-repainting overlay indicator that visualizes EMA slope strength as an angle in degrees, providing instant visual feedback through dynamic EMA coloring and comprehensive trend analysis.
## ORIGINALITY
This indicator is original in its approach to slope measurement:
- **Angle-based calculation**: Uses arctangent to calculate slope as an angle in degrees (not percentage), providing a more intuitive measure of trend strength
- **Dynamic visual feedback**: Combines real-time EMA line coloring with regime detection, creating a continuous visual representation of market conditions
- **Comprehensive analysis**: Integrates angle-based trend shift signals with optional statistical analysis in a single, cohesive tool
- **Non-repainting design**: All calculations use confirmed bars only, ensuring reliable, deterministic output
## HOW IT WORKS
The indicator calculates the EMA slope angle using trigonometric functions:
```
Angle = arctan((EMA_current - EMA_past) / lookback_bars) × 180/π
```
This provides an intuitive measure where:
- **Steep angles** = strong trends (visualized with saturated colors)
- **Shallow angles** = weak trends (visualized with lighter colors)
- **Near-zero angles** = flat/consolidation (visualized in gray)
The EMA line color dynamically reflects:
- **Direction**: Green shades for uptrends, red shades for downtrends
- **Strength**: Color intensity based on normalized angle (stronger slopes = more saturated colors)
- **Regime**: Gray for flat conditions when angle is below threshold
## KEY FEATURES
### Dynamic EMA Coloring
- EMA line color changes continuously based on slope strength
- Color intensity reflects trend strength (50-100% opacity range)
- Instant visual feedback without cluttering the chart
### Regime Detection
- Automatically classifies market conditions: **RISING**, **FALLING**, or **FLAT**
- Configurable angle thresholds for regime classification
- Real-time regime updates on confirmed bars only
### Trend-Shift Signals
- Detects transitions from FLAT to RISING/FALLING regimes
- Visual arrows on chart when significant trend shifts occur
- Prevents signal spam by only triggering from FLAT state
- Configurable trigger thresholds for signal sensitivity
### KPI Dashboard
- Real-time angle display (rounded to 1 decimal place)
- Current regime status with color coding
- Last signal tracking (UP/DOWN/NONE)
- Positioned in top-right corner for easy reference
### Advanced Angle Statistics (Optional)
- Detailed breakdown of angle distribution across 9 granular buckets:
- 0-0.2°, 0.2-0.5°, 0.5-1°, 1-1.5°, 1.5-2°, 2-3°, 3-5°, 5-10°, >10°
- Shows count and percentage for each bucket
- Automatically resets on symbol/timeframe changes
- Useful for analyzing historical slope patterns
## SETTINGS
### Main Settings
- **EMA Length**: Period for exponential moving average (default: 50)
- **Slope Lookback Bars**: Number of bars to compare for slope calculation (default: 5)
### Angle Settings
- **Flat Angle Threshold**: Maximum angle for FLAT regime classification (default: 2.0°)
- **Rising Angle Trigger**: Minimum angle to trigger RISING regime and UP signals (default: 1.0°)
- **Falling Angle Trigger**: Maximum angle to trigger FALLING regime and DOWN signals (default: -1.0°)
- **Max Angle for Color Saturation**: Maximum angle for full color intensity (default: 30.0°)
### Display Options
- **Uptrend Color**: Color for rising trends (default: dark green)
- **Downtrend Color**: Color for falling trends (default: dark red)
- **Flat Color**: Color for flat conditions (default: gray)
- **Show Trend-Shift Signals**: Toggle signal arrows on/off (default: true)
- **Show Angle Statistics**: Toggle statistics dashboard on/off (default: false)
## NON-REPAINTING GUARANTEE
- All calculations use confirmed bars only (`barstate.isconfirmed`)
- No future bar references
- No higher timeframe calls using `request.security()`
- Deterministic output - what you see is what you get
- Reliable for backtesting and live trading
## USE CASES
- **Trend Identification**: Instantly identify trend strength and direction at a glance
- **Reversal Detection**: Spot trend reversals early through regime changes
- **Trade Filtering**: Filter trades based on slope strength and regime
- **Consolidation Monitoring**: Identify flat market conditions for range trading
- **Pattern Analysis**: Study historical angle distributions to understand market behavior
- **Momentum Assessment**: Gauge trend momentum through visual color intensity
## LIMITATIONS
- Angle calculation depends on EMA length and lookback period settings
- Regime classification is based on configurable thresholds - adjust to match your trading style
- Signals only trigger when transitioning from FLAT state to prevent spam
- Statistics reset on symbol/timeframe changes (by design)
- Color intensity is normalized to max angle setting - adjust for your market's typical ranges
## TECHNICAL NOTES
- Uses Pine Script v6
- Overlay indicator (plots on price chart)
- No external dependencies
- Compatible with all TradingView chart types
- Works on all timeframes and symbols
## DISCLAIMER
This indicator is designed for visual trend analysis and educational purposes. Always combine with other technical analysis tools, fundamental analysis, and proper risk management strategies. Past performance does not guarantee future results. Trading involves risk of loss.
---
**Perfect for**: Swing traders, day traders, trend followers, and market analysts seeking intuitive trend strength visualization.

P6●智能资金概念交易系统//@version=5
indicator("P6●智能资金概念交易系统", overlay=true, max_boxes_count = 500, max_labels_count = 500)
// === 参数分类标题 ===
// --------------------------
// 1. 基础指标设置
// --------------------------
// 2. 范围过滤器 设置
// --------------------------
// 3. ADX 趋势过滤器 设置
// --------------------------
// 4. 趋势线 设置
// --------------------------
// 5. 支撑与阻力 设置
// --------------------------
// 6. PMA 设置
// --------------------------
// 7. 交易信息表格 设置
// --------------------------
// 8. 顶部规避 设置
// --------------------------
// 9. 底部规避 设置
// --------------------------
// 10. RSI 动量指标 设置
// --------------------------
// 11. 多时间框架 设置
// --------------------------
// === 显示/隐藏选项 ===
showRangeFilter = input.bool(true, title="显示 范围过滤器", group="1. 基础指标设置")
showADXFilter = input.bool(true, title="启用 ADX 趋势过滤器", group="1. 基础指标设置")
showTrendLines = input.bool(false, title="显示 趋势线", group="1. 基础指标设置")
showSupRes = input.bool(true, title="显示 支撑与阻力", group="1. 基础指标设置")
showPMA = input.bool(true, title="显示 多周期移动平均线", group="1. 基础指标设置")
showTable = input.bool(true, title="显示 交易信息表格", group="1. 基础指标设置")
showTopAvoidance = input.bool(false, title="启用 顶部规避系统", group="1. 基础指标设置")
showBottomAvoidance = input.bool(false, title="启用 底部规避系统", group="1. 基础指标设置")
showRSI = input.bool(false, title="启用 RSI 动量指标", group="1. 基础指标设置")
showMTF = input.bool(true, title="启用 多时间框架分析", group="1. 基础指标设置")
// === RSI 动量指标 设置 ===
rsiLength = input.int(14, title="RSI 周期", minval=1, group="10. RSI 动量指标 设置")
rsiOverbought = input.float(70.0, title="超买阈值", minval=50, maxval=90, step=1, group="10. RSI 动量指标 设置")
rsiOversold = input.float(30.0, title="超卖阈值", minval=10, maxval=50, step=1, group="10. RSI 动量指标 设置")
rsiNeutralUpper = input.float(60.0, title="中性区间上沿", minval=50, maxval=70, step=1, group="10. RSI 动量指标 设置")
rsiNeutralLower = input.float(40.0, title="中性区间下沿", minval=30, maxval=50, step=1, group="10. RSI 动量指标 设置")
// === 多时间框架设置 ===
mtfEnable1m = input.bool(true, title="启用 1分钟", group="11. 多时间框架 设置")
mtfEnable5m = input.bool(true, title="启用 5分钟", group="11. 多时间框架 设置")
mtfEnable15m = input.bool(true, title="启用 15分钟", group="11. 多时间框架 设置")
mtfEnable1h = input.bool(true, title="启用 1小时", group="11. 多时间框架 设置")
mtfEnable4h = input.bool(true, title="启用 4小时", group="11. 多时间框架 设置")
// === RSI 计算与状态判断 ===
rsiValue = ta.rsi(close, rsiLength)
rsiPrevious = ta.rsi(close , rsiLength)
// RSI 动量状态判断
getRSIStatus() =>
status = "动量中性"
// 动量回落条件:RSI从高位下降或处于下降趋势
fallCondition1 = rsiValue < rsiPrevious and rsiValue > rsiNeutralUpper
fallCondition2 = rsiValue >= rsiOverbought and rsiValue < rsiPrevious
fallCondition3 = rsiPrevious >= rsiOverbought and rsiValue < rsiOverbought and rsiValue < rsiPrevious
if fallCondition1 or fallCondition2 or fallCondition3
status := "动量回落"
// 动量回升条件:RSI从低位上升或处于上升趋势
riseCondition1 = rsiValue > rsiPrevious and rsiValue < rsiNeutralLower
riseCondition2 = rsiValue <= rsiOversold and rsiValue > rsiPrevious
riseCondition3 = rsiPrevious <= rsiOversold and rsiValue > rsiOversold and rsiValue > rsiPrevious
if riseCondition1 or riseCondition2 or riseCondition3
status := "动量回升"
// 动量中性条件:RSI在中性区间或无明确趋势
if rsiValue >= rsiNeutralLower and rsiValue <= rsiNeutralUpper
status := "动量中性"
status
rsiStatus = getRSIStatus()
// RSI 信号与其他指标结合
rsiSupportsBuy = rsiStatus == "动量回升" or (rsiValue <= rsiOversold and rsiValue > rsiPrevious)
rsiSupportssell = rsiStatus == "动量回落" or (rsiValue >= rsiOverbought and rsiValue < rsiPrevious)
// === 多时间框架数据获取 ===
// 简化的多时间框架趋势计算
calcSimpleTrend(src) =>
ema21 = ta.ema(src, 21)
ema50 = ta.ema(src, 50)
trend = src > ema21 and ema21 > ema50 ? 1 : src < ema21 and ema21 < ema50 ? -1 : 0
trend
// 获取各时间框架的趋势数据
trend1m = showMTF and mtfEnable1m ? request.security(syminfo.tickerid, "1", calcSimpleTrend(close)) : 0
trend5m = showMTF and mtfEnable5m ? request.security(syminfo.tickerid, "5", calcSimpleTrend(close)) : 0
trend15m = showMTF and mtfEnable15m ? request.security(syminfo.tickerid, "15", calcSimpleTrend(close)) : 0
trend1h = showMTF and mtfEnable1h ? request.security(syminfo.tickerid, "60", calcSimpleTrend(close)) : 0
trend4h = showMTF and mtfEnable4h ? request.security(syminfo.tickerid, "240", calcSimpleTrend(close)) : 0
// === 多时间框架趋势判断函数 ===
getTrendDirection(trend) =>
if trend > 0
"多头倾向"
else if trend < 0
"空头倾向"
else
"震荡"
// 获取各时间框架趋势方向
trend1mDir = getTrendDirection(trend1m)
trend5mDir = getTrendDirection(trend5m)
trend15mDir = getTrendDirection(trend15m)
trend1hDir = getTrendDirection(trend1h)
trend4hDir = getTrendDirection(trend4h)
// === 顶部规避系统 ===
ma_period_top = input.int(10, 'MA Period (Length)', group='8. 顶部规避 设置')
topThreshold = input.int(85, 'VAR顶部阈值', minval=70, maxval=95, step=1, group='8. 顶部规避 设置')
// 计算VAR指标 - 顶部(检测上涨动能)
pre_price_top = close
VAR_top = ta.sma(math.max(close-pre_price_top,0), ma_period_top) / ta.sma(math.abs(close-pre_price_top), ma_period_top) * 100
// 顶部信号 - 当上涨动能达到高位时
isTop = VAR_top > topThreshold and VAR_top <= topThreshold
// 图表显示顶部标记
plotshape(series=showTopAvoidance and isTop, title="顶", style=shape.labeldown, location=location.abovebar,
color=color.new(color.purple, 0), textcolor=color.white, size=size.normal, text="顶")
// === 底部规避系统 ===
ma_period_bottom = input.int(14, 'MA Period (Length)', group='9. 底部规避 设置')
bottomThreshold = input.int(15, 'VAR底部阈值', minval=5, maxval=30, step=1, group='9. 底部规避 设置')
// 计算VAR指标 - 底部(检测下跌动能)
pre_price_bottom = close
VAR_bottom = ta.sma(math.max(pre_price_bottom-close,0), ma_period_bottom) / ta.sma(math.abs(close-pre_price_bottom), ma_period_bottom) * 100
// 底部信号 - 当下跌动能达到高位时
isBottom = VAR_bottom > bottomThreshold and VAR_bottom <= bottomThreshold
// 图表显示底部标记
plotshape(series=showBottomAvoidance and isBottom, title="底", style=shape.labelup, location=location.belowbar,
color=color.new(color.orange, 0), textcolor=color.white, size=size.normal, text="底")
// === 范围过滤器 部分 ===
upColor = color.white
midColor = #90bff9
downColor = color.blue
src = input(defval=close, title="数据源", group="2. 范围过滤器 设置")
per = input.int(defval=100, minval=1, title="采样周期", group="2. 范围过滤器 设置")
mult = input.float(defval=3.0, minval=0.1, title="区间倍数", group="2. 范围过滤器 设置")
smoothrng(x, t, m) =>
wper = t * 2 - 1
avrng = ta.ema(math.abs(x - x ), t)
smoothrng = ta.ema(avrng, wper) * m
smoothrng
smrng = smoothrng(src, per, mult)
rngfilt(x, r) =>
rngfilt = x
rngfilt := x > nz(rngfilt ) ? x - r < nz(rngfilt ) ? nz(rngfilt ) : x - r :
x + r > nz(rngfilt ) ? nz(rngfilt ) : x + r
rngfilt
filt = rngfilt(src, smrng)
upward = 0.0
upward := filt > filt ? nz(upward ) + 1 : filt < filt ? 0 : nz(upward )
downward = 0.0
downward := filt < filt ? nz(downward ) + 1 : filt > filt ? 0 : nz(downward )
hband = filt + smrng
lband = filt - smrng
filtcolor = upward > 0 ? upColor : downward > 0 ? downColor : midColor
barcolor_ = src > filt and src > src and upward > 0 ? upColor :
src > filt and src < src and upward > 0 ? upColor :
src < filt and src < src and downward > 0 ? downColor :
src < filt and src > src and downward > 0 ? downColor : midColor
longCond = bool(na)
shortCond = bool(na)
longCond := src > filt and src > src and upward > 0 or
src > filt and src < src and upward > 0
shortCond := src < filt and src < src and downward > 0 or
src < filt and src > src and downward > 0
CondIni = 0
CondIni := longCond ? 1 : shortCond ? -1 : CondIni
// === ADX 趋势过滤器 部分 ===
adxLength = input.int(defval=14, minval=1, title="ADX 周期", group="3. ADX 趋势过滤器 设置")
adxThreshold = input.float(defval=25.0, minval=0, maxval=100, step=0.5, title="ADX 阈值", tooltip="ADX大于此值才允许交易信号", group="3. ADX 趋势过滤器 设置")
// 简化的ADX计算 - 更准确的方法
calcADX(len) =>
up = ta.change(high)
down = -ta.change(low)
plusDM = na(up) ? na : (up > down and up > 0 ? up : 0)
minusDM = na(down) ? na : (down > up and down > 0 ? down : 0)
truerange = ta.rma(ta.tr, len)
plus = fixnan(100 * ta.rma(plusDM, len) / truerange)
minus = fixnan(100 * ta.rma(minusDM, len) / truerange)
sum = plus + minus
adx = 100 * ta.rma(math.abs(plus - minus) / (sum == 0 ? 1 : sum), len)
= calcADX(adxLength)
// ADX状态判断
adxStrong = adxValue >= adxThreshold
adxTrendUp = diPlus > diMinus
adxTrendDown = diMinus > diPlus
// 修改信号生成逻辑,加入顶部和底部规避以及RSI确认
longCondition = longCond and CondIni == -1 and (not showADXFilter or adxStrong) and (not showTopAvoidance or not isTop) and (not showRSI or rsiSupportsBuy)
shortCondition = shortCond and CondIni == 1 and (not showADXFilter or adxStrong) and (not showBottomAvoidance or not isBottom) and (not showRSI or rsiSupportssell)
// === 记录买卖信号价格 ===
var float entryPrice = na
var string entryType = na
var float entryTime = na
// 当出现买入信号时记录
if longCondition
entryPrice := close
entryType := "多单"
entryTime := time
// 当出现卖出信号时记录
if shortCondition
entryPrice := close
entryType := "空单"
entryTime := time
// === 趋势颜色逻辑 ===
var trendColor = color.gray
if longCondition
trendColor := color.green
else if shortCondition
trendColor := color.red
// ADX线绘制(可选)- 已隐藏显示
adxColor = adxStrong ? (adxTrendUp ? color.green : color.red) : color.gray
// plot(showADXLine and showADXFilter ? adxValue : na, title="平均方向指数", color=adxColor, linewidth=1)
// hline(showADXLine and showADXFilter ? adxThreshold : na, title="ADX阈值线", color=color.yellow, linestyle=hline.style_dashed)
// 绘图部分 - 已隐藏线条显示,保留功能
// filtplot = plot(showRangeFilter ? filt : na, color=trendColor, linewidth=2, title="区间过滤器")
// hbandplot = plot(showRangeFilter ? hband : na, color=color.new(trendColor, 30), title="上轨线", linewidth=1)
// lbandplot = plot(showRangeFilter ? lband : na, color=color.new(trendColor, 30), title="下轨线", linewidth=1)
// barcolor(na) - 已隐藏K线颜色
plotshape(showRangeFilter and longCondition, title="买入信号", text="买", textcolor=color.white, style=shape.labelup, size=size.small, location=location.belowbar, color=color.new(color.green, 20))
plotshape(showRangeFilter and shortCondition, title="卖出信号", text="卖", textcolor=color.white, style=shape.labeldown, size=size.small, location=location.abovebar, color=color.new(color.red, 20))
// === 趋势线 部分 ===
length_tl = input.int(14, '分型回溯长度', group="4. 趋势线 设置")
mult_tl = input.float(1., '斜率系数', minval = 0, step = .1, group="4. 趋势线 设置")
calcMethod = input.string('平均真实波幅', '斜率计算方法', options = , group="4. 趋势线 设置")
backpaint = input(true, tooltip = '回溯显示:将可视元素向历史偏移,禁用后可查看实时信号。', group="4. 趋势线 设置")
upCss = input.color(color.teal, '上升趋势线颜色', group = "4. 趋势线 设置")
dnCss = input.color(color.red, '下降趋势线颜色', group = "4. 趋势线 设置")
showExt = input(true, '显示延长线', group="4. 趋势线 设置")
var upper_tl = 0.
var lower_tl = 0.
var slope_ph_tl = 0.
var slope_pl_tl = 0.
var offset_tl = backpaint ? length_tl : 0
n = bar_index
src_tl = close
ph = ta.pivothigh(length_tl, length_tl)
pl = ta.pivotlow(length_tl, length_tl)
slope = switch calcMethod
'平均真实波幅' => ta.atr(length_tl) / length_tl * mult_tl
'标准差' => ta.stdev(src_tl, length_tl) / length_tl * mult_tl
'线性回归' => math.abs(ta.sma(src_tl * n, length_tl) - ta.sma(src_tl, length_tl) * ta.sma(n, length_tl)) / ta.variance(n, length_tl) / 2 * mult_tl
slope_ph_tl := ph ? slope : slope_ph_tl
slope_pl_tl := pl ? slope : slope_pl_tl
upper_tl := ph ? ph : upper_tl - slope_ph_tl
lower_tl := pl ? pl : lower_tl + slope_pl_tl
var upos = 0
var dnos = 0
upos := ph ? 0 : close > upper_tl - slope_ph_tl * length_tl ? 1 : upos
dnos := pl ? 0 : close < lower_tl + slope_pl_tl * length_tl ? 1 : dnos
var uptl = line.new(na,na,na,na, color = upCss, style = line.style_dashed, extend = extend.right)
var dntl = line.new(na,na,na,na, color = dnCss, style = line.style_dashed, extend = extend.right)
if ph and showExt and showTrendLines
line.set_xy1(uptl, n-offset_tl, backpaint ? ph : upper_tl - slope_ph_tl * length_tl)
line.set_xy2(uptl, n-offset_tl+1, backpaint ? ph - slope : upper_tl - slope_ph_tl * (length_tl+1))
if pl and showExt and showTrendLines
line.set_xy1(dntl, n-offset_tl, backpaint ? pl : lower_tl + slope_pl_tl * length_tl)
line.set_xy2(dntl, n-offset_tl+1, backpaint ? pl + slope : lower_tl + slope_pl_tl * (length_tl+1))
plot(showTrendLines ? (backpaint ? upper_tl : upper_tl - slope_ph_tl * length_tl) : na, '上升趋势线', color = ph ? na : upCss, offset = -offset_tl)
plot(showTrendLines ? (backpaint ? lower_tl : lower_tl + slope_pl_tl * length_tl) : na, '下降趋势线', color = pl ? na : dnCss, offset = -offset_tl)
// 趋势线突破也需要ADX确认,并加入顶部和底部规避以及RSI确认
trendLineBuySignal = showTrendLines and upos > upos and (not showADXFilter or adxStrong) and (not showTopAvoidance or not isTop) and (not showRSI or rsiSupportsBuy)
trendLineSellSignal = showTrendLines and dnos > dnos and (not showADXFilter or adxStrong) and (not showBottomAvoidance or not isBottom) and (not showRSI or rsiSupportssell)
plotshape(trendLineBuySignal ? low : na, "上轨突破"
, shape.labelup
, location.absolute
, upCss
, text = "突"
, textcolor = color.white
, size = size.tiny)
plotshape(trendLineSellSignal ? high : na, "下轨突破"
, shape.labeldown
, location.absolute
, dnCss
, text = "突"
, textcolor = color.white
, size = size.tiny)
alertcondition(trendLineBuySignal, '上轨突破', '价格向上突破下趋势线')
alertcondition(trendLineSellSignal, '下轨突破', '价格向下突破上趋势线')
// === 支撑与阻力 部分 ===
g_sr = '5. 支撑与阻力'
g_c = '条件'
g_st = '样式'
t_r = 'K线确认:仅在K线收盘时生成警报(延后1根K线)。\n\n高点与低点:默认情况下,突破/回踩系统使用当前收盘价判断,选择高点与低点后将使用高低点判断条件,不再重绘,结果会不同。'
t_rv = '每当检测到潜在回踩时,指标会判断回踩事件即将发生。此输入用于设置在潜在回踩激活时,最大允许检测多少根K线。\n\n例如,出现潜在回踩标签时,该标签允许存在多少根K线以确认回踩?此功能防止回踩警报在10根K线后才触发导致不准确。'
input_lookback = input.int(defval = 20, title = '回溯区间', minval = 1, tooltip = '检测分型事件的K线数量。', group = g_sr)
input_retSince = input.int(defval = 2, title = '突破后K线数', minval = 1, tooltip = '突破后多少根K线内检测回踩。', group = g_sr)
input_retValid = input.int(defval = 2, title = '回踩检测限制', minval = 1, tooltip = t_rv, group = g_sr)
input_breakout = input.bool(defval = true, title = '显示突破', group = g_c)
input_retest = input.bool(defval = true, title = '显示回踩', group = g_c)
input_repType = input.string(defval = '开启', title = '重绘模式', options = , tooltip = t_r, group = g_c)
input_outL = input.string(defval = line.style_dotted, title = '边框样式', group = g_st, options = )
input_extend = input.string(defval = extend.none, title = '延长方向', group = g_st, options = )
input_labelType = input.string(defval = '详细', title = '标签类型', options = , group = g_st)
input_labelSize = input.string(defval = size.small, title = '标签大小', options = , group = g_st)
st_break_lb_co1 = input.color(defval = color.lime , title = '空头突破标签颜色' ,inline = 'st_break_lb_co', group = g_st)
st_break_lb_co2 = input.color(defval = color.new(color.lime,40) , title = '' ,inline = 'st_break_lb_co', group = g_st)
lg_break_lb_co1 = input.color(defval = color.red , title = '多头突破标签颜色' ,inline = 'lg_break_lb_co', group = g_st)
lg_break_lb_co2 = input.color(defval = color.new(color.red,40) , title = '' ,inline = 'lg_break_lb_co', group = g_st)
st_retest_lb_co1 = input.color(defval = color.lime , title = '空头回踩标签颜色' ,inline = 'st_retest_lb_col', group = g_st)
st_retest_lb_co2 = input.color(defval = color.new(color.lime,40) , title = '' ,inline = 'st_retest_lb_col', group = g_st)
lg_retest_lb_co1 = input.color(defval = color.red , title = '多头回踩标签颜色' ,inline = 'lg_retest_lb_co', group = g_st)
lg_retest_lb_co2 = input.color(defval = color.new(color.red,40) , title = '' ,inline = 'lg_retest_lb_co', group = g_st)
input_plColor1 = input.color(defval = color.lime, title = '支撑方框颜色', inline = 'pl_Color', group = g_st)
input_plColor2 = input.color(defval = color.new(color.lime,85), title = '', inline = 'pl_Color', group = g_st)
input_phColor1 = input.color(defval = color.red, title = '阻力方框颜色', inline = 'ph_Color', group = g_st)
input_phColor2 = input.color(defval = color.new(color.red,85), title = '', inline = 'ph_Color', group = g_st)
input_override = input.bool(defval = false, title = '自定义文字颜色', inline = '覆盖', group = g_st)
input_textColor = input.color(defval = color.white, title = '', inline = '覆盖', group = g_st)
bb = input_lookback
// 兼容label与英文选项
rTon = input_repType == '开启'
rTcc = input_repType == '关闭:K线确认'
rThv = input_repType == '关闭:高低点'
breakText = input_labelType == '简洁' ? '突' : '突破'
// 分型
rs_pl = fixnan(ta.pivotlow(low, bb, bb))
rs_ph = fixnan(ta.pivothigh(high, bb, bb))
// Box 高度
s_yLoc = low > low ? low : low
r_yLoc = high > high ? high : high
//-----------------------------------------------------------------------------
// 函数
//-----------------------------------------------------------------------------
drawBox(condition, y1, y2, color,bgcolor) =>
var box drawBox = na
if condition and showSupRes // 仅在显示开关打开时绘制
box.set_right(drawBox, bar_index - bb)
drawBox.set_extend(extend.none)
drawBox := box.new(bar_index - bb, y1, bar_index, y2, color, bgcolor = bgcolor, border_style = input_outL, extend = input_extend)
updateBox(box) =>
if barstate.isconfirmed and showSupRes
box.set_right(box, bar_index + 5)
breakLabel(y, txt_col,lb_col, style, textform) =>
if showSupRes
label.new(bar_index, y, textform, textcolor = input_override ? input_textColor : txt_col, style = style, color = lb_col, size = input_labelSize)
retestCondition(breakout, condition) =>
ta.barssince(na(breakout)) > input_retSince and condition
repaint(c1, c2, c3) => rTon ? c1 : rThv ? c2 : rTcc ? c3 : na
//-----------------------------------------------------------------------------
// 绘制与更新区间
//-----------------------------------------------------------------------------
= drawBox(ta.change(rs_pl), s_yLoc, rs_pl, input_plColor1,input_plColor2)
= drawBox(ta.change(rs_ph), rs_ph, r_yLoc, input_phColor1,input_phColor2)
sTop = box.get_top(sBox), rTop = box.get_top(rBox)
sBot = box.get_bottom(sBox), rBot = box.get_bottom(rBox)
if showSupRes
updateBox(sBox), updateBox(rBox)
//-----------------------------------------------------------------------------
// 突破事件 - 加入顶部和底部规避以及RSI确认
//-----------------------------------------------------------------------------
var bool sBreak = na
var bool rBreak = na
cu = repaint(ta.crossunder(close, box.get_bottom(sBox)), ta.crossunder(low, box.get_bottom(sBox)), ta.crossunder(close, box.get_bottom(sBox)) and barstate.isconfirmed)
co = repaint(ta.crossover(close, box.get_top(rBox)), ta.crossover(high, box.get_top(rBox)), ta.crossover(close, box.get_top(rBox)) and barstate.isconfirmed)
switch
cu and na(sBreak) and showSupRes and (not showADXFilter or adxStrong) and (not showBottomAvoidance or not isBottom) and (not showRSI or rsiSupportssell) =>
sBreak := true
if input_breakout
breakLabel(sBot, st_break_lb_co1,st_break_lb_co2, label.style_label_upper_right, breakText)
co and na(rBreak) and showSupRes and (not showADXFilter or adxStrong) and (not showTopAvoidance or not isTop) and (not showRSI or rsiSupportsBuy) =>
rBreak := true
if input_breakout
breakLabel(rTop, lg_break_lb_co1,lg_break_lb_co2, label.style_label_lower_right, breakText)
if ta.change(rs_pl) and showSupRes
if na(sBreak)
box.delete(sBox )
sBreak := na
if ta.change(rs_ph) and showSupRes
if na(rBreak)
box.delete(rBox )
rBreak := na
//-----------------------------------------------------------------------------
// 回踩事件
//-----------------------------------------------------------------------------
s1 = retestCondition(sBreak, high >= sTop and close <= sBot)
s2 = retestCondition(sBreak, high >= sTop and close >= sBot and close <= sTop)
s3 = retestCondition(sBreak, high >= sBot and high <= sTop)
s4 = retestCondition(sBreak, high >= sBot and high <= sTop and close < sBot)
r1 = retestCondition(rBreak, low <= rBot and close >= rTop)
r2 = retestCondition(rBreak, low <= rBot and close <= rTop and close >= rBot)
r3 = retestCondition(rBreak, low <= rTop and low >= rBot)
r4 = retestCondition(rBreak, low <= rTop and low >= rBot and close > rTop)
retestEvent(c1, c2, c3, c4, y1, y2, txt_col,lb_col, style, pType) =>
if input_retest and showSupRes
var bool retOccurred = na
retActive = c1 or c2 or c3 or c4
retEvent = retActive and not retActive
retValue = ta.valuewhen(retEvent, y1, 0)
if pType == 'ph' ? y2 < ta.valuewhen(retEvent, y2, 0) : y2 > ta.valuewhen(retEvent, y2, 0)
retEvent := retActive
retValue := ta.valuewhen(retEvent, y1, 0)
retSince = ta.barssince(retEvent)
var retLabel = array.new()
if retEvent
retOccurred := na
array.push(retLabel, label.new(bar_index - retSince, y2 , text = input_labelType == '简洁' ? '潜回' : '潜在回踩', color = lb_col, style = style, textcolor = input_override ? input_textColor : txt_col, size = input_labelSize))
if array.size(retLabel) == 2
label.delete(array.first(retLabel))
array.shift(retLabel)
retConditions = pType == 'ph' ? repaint(close >= retValue, high >= retValue, close >= retValue and barstate.isconfirmed) : repaint(close <= retValue, low <= retValue, close <= retValue and barstate.isconfirmed)
retValid = ta.barssince(retEvent) > 0 and ta.barssince(retEvent) <= input_retValid and retConditions and not retOccurred and (not showADXFilter or adxStrong) and (not showRSI or (pType == 'ph' ? rsiSupportsBuy : rsiSupportssell))
if retValid
label.new(bar_index - retSince, y2 , text = input_labelType == '简洁' ? '回' : '回踩', color = lb_col, style = style, textcolor = input_override ? input_textColor : txt_col, size = input_labelSize)
retOccurred := true
if retValid or ta.barssince(retEvent) > input_retValid
label.delete(array.first(retLabel))
if pType == 'ph' and ta.change(rs_ph) and retOccurred
box.set_right(rBox , bar_index - retSince)
retOccurred := na
if pType == 'pl' and ta.change(rs_pl) and retOccurred
box.set_right(sBox , bar_index - retSince)
retOccurred := na
else
= retestEvent(r1, r2, r3, r4, high, low, lg_retest_lb_co1,lg_retest_lb_co2, label.style_label_upper_left, 'ph')
= retestEvent(s1, s2, s3, s4, low, high, st_retest_lb_co1,st_retest_lb_co2, label.style_label_lower_left, 'pl')
//-----------------------------------------------------------------------------
// 警报
//-----------------------------------------------------------------------------
// 买卖信号警报条件
buySignal = showTrendLines and trendLineBuySignal
sellSignal = showTrendLines and trendLineSellSignal
// 添加买卖信号的警报条件
alertcondition(buySignal, title='买入信号', message='范围过滤器买入信号:上轨突破')
alertcondition(sellSignal, title='卖出信号', message='范围过滤器卖出信号:下轨突破')
alertcondition((showSupRes and ta.change(rs_pl)), '新支撑位')
alertcondition((showSupRes and ta.change(rs_ph)), '新阻力位')
alertcondition((showSupRes and ta.barssince(na(sBreak)) == 1), '支撑位突破')
alertcondition((showSupRes and ta.barssince(na(rBreak)) == 1), '阻力位突破')
alertcondition((showSupRes and sRetValid), '支撑位回踩')
alertcondition((showSupRes and sRetEvent), '潜在支撑回踩')
alertcondition((showSupRes and rRetValid), '阻力位回踩')
alertcondition((showSupRes and rRetEvent), '潜在阻力回踩')
AllAlerts(condition, message) =>
if condition and showSupRes
alert(message)
AllAlerts(ta.change(rs_pl), '新支撑位')
AllAlerts(ta.change(rs_ph), '新阻力位')
AllAlerts(ta.barssince(na(sBreak)) == 1, '支撑位突破')
AllAlerts(ta.barssince(na(rBreak)) == 1, '阻力位突破')
AllAlerts(sRetValid, '支撑位回踩')
AllAlerts(sRetEvent, '潜在支撑回踩')
AllAlerts(rRetValid, '阻力位回踩')
AllAlerts(rRetEvent, '潜在阻力回踩')
AllAlerts(buySignal, '买入信号:上轨突破')
AllAlerts(sellSignal, '卖出信号:下轨突破')
// === 多周期移动平均线 部分 ===
// === 公共函数 ===
strRoundValue(num) =>
strv = ''
if num >= 100000
strv := str.tostring(num/1000, '#千')
else if (num < 100000) and (num >= 100)
strv := str.tostring(num, '#')
else if (num < 100) and (num >= 1)
strv := str.tostring(num, '#.##')
else if (num < 1) and (num >= 0.01)
strv := str.tostring(num, '#.####')
else if (num < 0.01) and (num >= 0.0001)
strv := str.tostring(num, '#.######')
else if (num < 0.0001) and (num >= 0.000001)
strv := str.tostring(num, '#.########')
(strv)
defaultFunction(func, src, len, alma_offst, alma_sigma) =>
has_len = false
ma = ta.swma(close)
if func == '自适应移动平均'
ma := ta.alma(src, len, alma_offst, alma_sigma)
has_len := true
else if func == '指数移动平均'
ma := ta.ema(src, len)
has_len := true
else if func == '修正移动平均'
ma := ta.rma(src, len)
has_len := true
else if func == '简单移动平均'
ma := ta.sma(src, len)
has_len := true
else if func == '对称加权移动平均'
ma := ta.swma(src)
has_len := false
else if func == '成交量加权平均价'
ma := ta.vwap(src)
has_len := false
else if func == '成交量加权移动平均'
ma := ta.vwma(src, len)
has_len := true
else if func == '加权移动平均'
ma := ta.wma(src, len)
has_len := true
def_fn = input.string(title='默认移动平均线', defval='指数移动平均', options= , group="6. PMA 设置")
ma1_on = input.bool(inline='均线1', title='启用移动平均线1', defval=false, group="6. PMA 设置")
ma2_on = input.bool(inline='均线2', title='启用移动平均线2', defval=true, group="6. PMA 设置")
ma3_on = input.bool(inline='均线3', title='启用移动平均线3', defval=true, group="6. PMA 设置")
ma4_on = input.bool(inline='均线4', title='启用移动平均线4', defval=true, group="6. PMA 设置")
ma5_on = input.bool(inline='均线5', title='启用移动平均线5', defval=true, group="6. PMA 设置")
ma6_on = input.bool(inline='均线6', title='启用移动平均线6', defval=true, group="6. PMA 设置")
ma7_on = input.bool(inline='均线7', title='启用移动平均线7', defval=true, group="6. PMA 设置")
ma1_fn = input.string(inline='均线1', title='', defval='默认', options= , group="6. PMA 设置")
ma2_fn = input.string(inline='均线2', title='', defval='默认', options= , group="6. PMA 设置")
ma3_fn = input.string(inline='均线3', title='', defval='默认', options= , group="6. PMA 设置")
ma4_fn = input.string(inline='均线4', title='', defval='默认', options= , group="6. PMA 设置")
ma5_fn = input.string(inline='均线5', title='', defval='默认', options= , group="6. PMA 设置")
ma6_fn = input.string(inline='均线6', title='', defval='默认', options= , group="6. PMA 设置")
ma7_fn = input.string(inline='均线7', title='', defval='默认', options= , group="6. PMA 设置")
ma1_len = input.int(inline='均线1', title='', defval=12, minval=1, group="6. PMA 设置")
ma2_len = input.int(inline='均线2', title='', defval=144, minval=1, group="6. PMA 设置")
ma3_len = input.int(inline='均线3', title='', defval=169, minval=1, group="6. PMA 设置")
ma4_len = input.int(inline='均线4', title='', defval=288, minval=1, group="6. PMA 设置")
ma5_len = input.int(inline='均线5', title='', defval=338, minval=1, group="6. PMA 设置")
ma6_len = input.int(inline='均线6', title='', defval=576, minval=1, group="6. PMA 设置")
ma7_len = input.int(inline='均线7', title='', defval=676, minval=1, group="6. PMA 设置")
alma1_offst = input.float(group='均线1其他设置', inline='均线11', title='自适应偏移', defval=0.85, minval=-1, maxval=1, step=0.01)
alma1_sigma = input.float(group='均线1其他设置', inline='均线11', title=', 西格玛', defval=6, minval=0, maxval=100, step=0.01)
ma1_src = input.source(group='均线1其他设置', inline='均线12', title='数据源', defval=close)
ma1_plt_offst = input.int(group='均线1其他设置', inline='均线12', title=', 绘图偏移', defval=0, minval=-500, maxval=500)
alma2_offst = input.float(group='均线2其他设置', inline='均线21', title='自适应偏移', defval=0.85, minval=-1, maxval=1, step=0.01)
alma2_sigma = input.float(group='均线2其他设置', inline='均线21', title='西格玛', defval=6, minval=0, maxval=100, step=0.01)
ma2_src = input.source(group='均线2其他设置', inline='均线22', title='数据源', defval=close)
ma2_plt_offst = input.int(group='均线2其他设置', inline='均线22', title='绘图偏移', defval=0, minval=-500, maxval=500)
alma3_offst = input.float(group='均线3其他设置', inline='均线31', title='自适应偏移', defval=0.85, minval=-1, maxval=1, step=0.01)
alma3_sigma = input.float(group='均线3其他设置', inline='均线31', title='西格玛', defval=6, minval=0, maxval=100, step=0.01)
ma3_src = input.source(group='均线3其他设置', inline='均线32', title='数据源', defval=close)
ma3_plt_offst = input.int(group='均线3其他设置', inline='均线32', title='绘图偏移', defval=0, minval=-500, maxval=500)
alma4_offst = input.float(group='均线4其他设置', inline='均线41', title='自适应偏移', defval=0.85, minval=-1, maxval=1, step=0.01)
alma4_sigma = input.float(group='均线4其他设置', inline='均线41', title='西格玛', defval=6, minval=0, maxval=100, step=0.01)
ma4_src = input.source(group='均线4其他设置', inline='均线42', title='数据源', defval=close)
ma4_plt_offst = input.int(group='均线4其他设置', inline='均线42', title='绘图偏移', defval=0, minval=-500, maxval=500)
alma5_offst = input.float(group='均线5其他设置', inline='均线51', title='自适应偏移', defval=0.85, minval=-1, maxval=1, step=0.01)
alma5_sigma = input.float(group='均线5其他设置', inline='均线51', title='西格玛', defval=6, minval=0, maxval=100, step=0.01)
ma5_src = input.source(group='均线5其他设置', inline='均线52', title='数据源', defval=close)
ma5_plt_offst = input.int(group='均线5其他设置', inline='均线52', title='绘图偏移', defval=0, minval=-500, maxval=500)
alma6_offst = input.float(group='均线6其他设置', inline='均线61', title='自适应偏移', defval=0.85, minval=-1, maxval=1, step=0.01)
alma6_sigma = input.float(group='均线6其他设置', inline='均线61', title='西格玛', defval=6, minval=0, maxval=100, step=0.01)
ma6_src = input.source(group='均线6其他设置', inline='均线62', title='数据源', defval=close)
ma6_plt_offst = input.int(group='均线6其他设置', inline='均线62', title='绘图偏移', defval=0, minval=-500, maxval=500)
alma7_offst = input.float(group='均线7其他设置', inline='均线71', title='自适应偏移', defval=0.85, minval=-1, maxval=1, step=0.01)
alma7_sigma = input.float(group='均线7其他设置', inline='均线71', title='西格玛', defval=6, minval=0, maxval=100, step=0.01)
ma7_src = input.source(group='均线7其他设置', inline='均线72', title='数据源', defval=close)
ma7_plt_offst = input.int(group='均线7其他设置', inline='均线72', title='绘图偏移', defval=0, minval=-500, maxval=500)
fill_12_on = input.bool(title='启用均线1-2填充', defval=false, group="6. PMA 设置")
fill_23_on = input.bool(title='启用均线2-3填充', defval=true, group="6. PMA 设置")
fill_34_on = input.bool(title='启用均线3-4填充', defval=false, group="6. PMA 设置")
fill_45_on = input.bool(title='启用均线4-5填充', defval=true, group="6. PMA 设置")
fill_56_on = input.bool(title='启用均线5-6填充', defval=false, group="6. PMA 设置")
fill_67_on = input.bool(title='启用均线6-7填充', defval=true, group="6. PMA 设置")
// === 计算移动平均线 ===
= defaultFunction(def_fn, ma1_src, ma1_len, alma1_offst, alma1_sigma)
= defaultFunction(def_fn, ma2_src, ma2_len, alma2_offst, alma2_sigma)
= defaultFunction(def_fn, ma3_src, ma3_len, alma3_offst, alma3_sigma)
= defaultFunction(def_fn, ma4_src, ma4_len, alma4_offst, alma4_sigma)
= defaultFunction(def_fn, ma5_src, ma5_len, alma5_offst, alma5_sigma)
= defaultFunction(def_fn, ma6_src, ma6_len, alma6_offst, alma6_sigma)
= defaultFunction(def_fn, ma7_src, ma7_len, alma7_offst, alma7_sigma)
// === 均线类型切换 ===
if ma1_fn != '默认'
if ma1_fn == '自适应移动平均'
ma1 := ta.alma(ma1_src, ma1_len, alma1_offst, alma1_sigma)
ma1_has_len := true
else if ma1_fn == '指数移动平均'
ma1 := ta.ema(ma1_src, ma1_len)
ma1_has_len := true
else if ma1_fn == '修正移动平均'
ma1 := ta.rma(ma1_src, ma1_len)
ma1_has_len := true
else if ma1_fn == '简单移动平均'
ma1 := ta.sma(ma1_src, ma1_len)
ma1_has_len := true
else if ma1_fn == '对称加权移动平均'
ma1 := ta.swma(ma1_src)
ma1_has_len := false
else if ma1_fn == '成交量加权平均价'
ma1 := ta.vwap(ma1_src)
ma1_has_len := false
else if ma1_fn == '成交量加权移动平均'
ma1 := ta.vwma(ma1_src, ma1_len)
ma1_has_len := true
else if ma1_fn == '加权移动平均'
ma1 := ta.wma(ma1_src, ma1_len)
ma1_has_len := true
if ma2_fn != '默认'
if ma2_fn == '自适应移动平均'
ma2 := ta.alma(ma2_src, ma2_len, alma2_offst, alma2_sigma)
ma2_has_len := true
else if ma2_fn == '指数移动平均'
ma2 := ta.ema(ma2_src, ma2_len)
ma2_has_len := true
else if ma2_fn == '修正移动平均'
ma2 := ta.rma(ma2_src, ma2_len)
ma2_has_len := true
else if ma2_fn == '简单移动平均'
ma2 := ta.sma(ma2_src, ma2_len)
ma2_has_len := true
else if ma2_fn == '对称加权移动平均'
ma2 := ta.swma(ma2_src)
ma2_has_len := false
else if ma2_fn == '成交量加权平均价'
ma2 := ta.vwap(ma2_src)
ma2_has_len := false
else if ma2_fn == '成交量加权移动平均'
ma2 := ta.vwma(ma2_src, ma2_len)
ma2_has_len := true
else if ma2_fn == '加权移动平均'
ma2 := ta.wma(ma2_src, ma2_len)
ma2_has_len := true
if ma3_fn != '默认'
if ma3_fn == '自适应移动平均'
ma3 := ta.alma(ma3_src, ma3_len, alma3_offst, alma3_sigma)
ma3_has_len := true
else if ma3_fn == '指数移动平均'
ma3 := ta.ema(ma3_src, ma3_len)
ma3_has_len := true
else if ma3_fn == '修正移动平均'
ma3 := ta.rma(ma3_src, ma3_len)
ma3_has_len := true
else if ma3_fn == '简单移动平均'
ma3 := ta.sma(ma3_src, ma3_len)
ma3_has_len := true
else if ma3_fn == '对称加权移动平均'
ma3 := ta.swma(ma3_src)
ma3_has_len := false
else if ma3_fn == '成交量加权平均价'
ma3 := ta.vwap(ma3_src)
ma3_has_len := false
else if ma3_fn == '成交量加权移动平均'
ma3 := ta.vwma(ma3_src, ma3_len)
ma3_has_len := true
else if ma3_fn == '加权移动平均'
ma3 := ta.wma(ma3_src, ma3_len)
ma3_has_len := true
if ma4_fn != '默认'
if ma4_fn == '自适应移动平均'
ma4 := ta.alma(ma4_src, ma4_len, alma4_offst, alma4_sigma)
ma4_has_len := true
else if ma4_fn == '指数移动平均'
ma4 := ta.ema(ma4_src, ma4_len)
ma4_has_len := true
else if ma4_fn == '修正移动平均'
ma4 := ta.rma(ma4_src, ma4_len)
ma4_has_len := true
else if ma4_fn == '简单移动平均'
ma4 := ta.sma(ma4_src, ma4_len)
ma4_has_len := true
else if ma4_fn == '对称加权移动平均'
ma4 := ta.swma(ma4_src)
ma4_has_len := false
else if ma4_fn == '成交量加权平均价'
ma4 := ta.vwap(ma4_src)
ma4_has_len := false
else if ma4_fn == '成交量加权移动平均'
ma4 := ta.vwma(ma4_src, ma4_len)
ma4_has_len := true
else if ma4_fn == '加权移动平均'
ma4 := ta.wma(ma4_src, ma4_len)
ma4_has_len := true
if ma5_fn != '默认'
if ma5_fn == '自适应移动平均'
ma5 := ta.alma(ma5_src, ma5_len, alma5_offst, alma5_sigma)
ma5_has_len := true
else if ma5_fn == '指数移动平均'
ma5 := ta.ema(ma5_src, ma5_len)
ma5_has_len := true
else if ma5_fn == '修正移动平均'
ma5 := ta.rma(ma5_src, ma5_len)
ma5_has_len := true
else if ma5_fn == '简单移动平均'
ma5 := ta.sma(ma5_src, ma5_len)
ma5_has_len := true
else if ma5_fn == '对称加权移动平均'
ma5 := ta.swma(ma5_src)
ma5_has_len := false
else if ma5_fn == '成交量加权平均价'
ma5 := ta.vwap(ma5_src)
ma5_has_len := false
else if ma5_fn == '成交量加权移动平均'
ma5 := ta.vwma(ma5_src, ma5_len)
ma5_has_len := true
else if ma5_fn == '加权移动平均'
ma5 := ta.wma(ma5_src, ma5_len)
ma5_has_len := true
if ma6_fn != '默认'
if ma6_fn == '自适应移动平均'
ma6 := ta.alma(ma6_src, ma6_len, alma6_offst, alma6_sigma)
ma6_has_len := true
else if ma6_fn == '指数移动平均'
ma6 := ta.ema(ma6_src, ma6_len)
ma6_has_len := true
else if ma6_fn == '修正移动平均'
ma6 := ta.rma(ma6_src, ma6_len)
ma6_has_len := true
else if ma6_fn == '简单移动平均'
ma6 := ta.sma(ma6_src, ma6_len)
ma6_has_len := true
else if ma6_fn == '对称加权移动平均'
ma6 := ta.swma(ma6_src)
ma6_has_len := false
else if ma6_fn == '成交量加权平均价'
ma6 := ta.vwap(ma6_src)
ma6_has_len := false
else if ma6_fn == '成交量加权移动平均'
ma6 := ta.vwma(ma6_src, ma6_len)
ma6_has_len := true
else if ma6_fn == '加权移动平均'
ma6 := ta.wma(ma6_src, ma6_len)
ma6_has_len := true
if ma7_fn != '默认'
if ma7_fn == '自适应移动平均'
ma7 := ta.alma(ma7_src, ma7_len, alma7_offst, alma7_sigma)
ma7_has_len := true
else if ma7_fn == '指数移动平均'
ma7 := ta.ema(ma7_src, ma7_len)
ma7_has_len := true
else if ma7_fn == '修正移动平均'
ma7 := ta.rma(ma7_src, ma7_len)
ma7_has_len := true
else if ma7_fn == '简单移动平均'
ma7 := ta.sma(ma7_src, ma7_len)
ma7_has_len := true
else if ma7_fn == '对称加权移动平均'
ma7 := ta.swma(ma7_src)
ma7_has_len := false
else if ma7_fn == '成交量加权平均价'
ma7 := ta.vwap(ma7_src)
ma7_has_len := false
else if ma7_fn == '成交量加权移动平均'
ma7 := ta.vwma(ma7_src, ma7_len)
ma7_has_len := true
else if ma7_fn == '加权移动平均'
ma7 := ta.wma(ma7_src, ma7_len)
ma7_has_len := true
// === 均线颜色 ===
ma1_clr = color.new(color.fuchsia, 0)
ma2_clr = color.new(color.aqua, 0)
ma3_clr = color.new(color.yellow, 0)
ma4_clr = color.new(color.blue, 0)
ma5_clr = color.new(color.orange, 0)
ma6_clr = color.new(color.green, 0)
ma7_clr = color.new(color.red, 0)
// === 均线全局绘图 ===
p1 = plot(series=showPMA and ma1_on ? ma1 : na, title="均线1", color=ma1_clr, trackprice=false, offset=ma1_plt_offst, linewidth=2)
p2 = plot(series=showPMA and ma2_on ? ma2 : na, title="均线2", color=ma2_clr, trackprice=false, offset=ma2_plt_offst, linewidth=2)
p3 = plot(series=showPMA and ma3_on ? ma3 : na, title="均线3", color=ma3_clr, trackprice=false, offset=ma3_plt_offst, linewidth=2)
p4 = plot(series=showPMA and ma4_on ? ma4 : na, title="均线4", color=ma4_clr, trackprice=false, offset=ma4_plt_offst, linewidth=2)
p5 = plot(series=showPMA and ma5_on ? ma5 : na, title="均线5", color=ma5_clr, trackprice=false, offset=ma5_plt_offst, linewidth=2)
p6 = plot(series=showPMA and ma6_on ? ma6 : na, title="均线6", color=ma6_clr, trackprice=false, offset=ma6_plt_offst, linewidth=2)
p7 = plot(series=showPMA and ma7_on ? ma7 : na, title="均线7", color=ma7_clr, trackprice=false, offset=ma7_plt_offst, linewidth=2)
// === 多周期移动平均线 填充渲染 ===
fill(p1, p2, color=showPMA and ma1_on and ma2_on and fill_12_on ? color.new(color.purple, 70) : na, title="均线1-2填充")
fill(p2, p3, color=showPMA and ma2_on and ma3_on and fill_23_on ? color.new(color.blue, 70) : na, title="均线2-3填充")
fill(p3, p4, color=showPMA and ma3_on and ma4_on and fill_34_on ? color.new(color.teal, 70) : na, title="均线3-4填充")
fill(p4, p5, color=showPMA and ma4_on and ma5_on and fill_45_on ? color.new(color.green, 70) : na, title="均线4-5填充")
fill(p5, p6, color=showPMA and ma5_on and ma6_on and fill_56_on ? color.new(color.yellow, 70) : na, title="均线5-6填充")
fill(p6, p7, color=showPMA and ma6_on and ma7_on and fill_67_on ? color.new(color.orange, 70) : na, title="均线6-7填充")
// === 交易信息表格 部分 ===
// 表格参数设置 - 修改默认大小为中等
tablePos = input.string("右上角", title="表格位置", options= , group="7. 交易信息表格 设置")
tableSize = input.string("中等", title="表格大小", options= , group="7. 交易信息表格 设置")
showTargets = input.bool(true, title="显示止盈目标", group="7. 交易信息表格 设置")
showRatio = input.bool(true, title="显示盈亏比", group="7. 交易信息表格 设置")
// 辅助函数
getTablePosition() =>
switch tablePos
"右上角" => position.top_right
"右下角" => position.bottom_right
"左上角" => position.top_left
"左下角" => position.bottom_left
getTableSize() =>
switch tableSize
"小" => size.small
"中等" => size.normal
"大" => size.large
formatPrice(price) =>
if na(price)
"N/A"
else
str.tostring(price, "#.####")
calcStopLossPercentage(entryPrice, stopLoss, entryType) =>
if na(entryPrice) or na(stopLoss) or na(entryType)
""
else
pct = 0.0
if entryType == "多单"
pct := (stopLoss - entryPrice) / entryPrice * 100
else if entryType == "空单"
pct := (entryPrice - stopLoss) / entryPrice * 100
" (" + str.tostring(pct, "#.##") + "%)"
calcTakeProfitPercentage(entryPrice, takeProfit, entryType) =>
if na(entryPrice) or na(takeProfit) or na(entryType)
""
else
pct = 0.0
if entryType == "多单"
pct := (takeProfit - entryPrice) / entryPrice * 100
else if entryType == "空单"
pct := (entryPrice - takeProfit) / entryPrice * 100
" (+" + str.tostring(pct, "#.##") + "%)"
calcUnrealizedPnL(entryPrice, currentPrice, entryType) =>
if na(entryPrice) or na(currentPrice) or na(entryType)
""
else
priceDiff = currentPrice - entryPrice
pct = (currentPrice - entryPrice) / entryPrice * 100
if entryType == "多单"
if pct > 0
" (" + formatPrice(priceDiff) + ", +" + str.tostring(pct, "#.##") + "%)"
else
" (" + formatPrice(priceDiff) + ", " + str.tostring(pct, "#.##") + "%)"
else if entryType == "空单"
// 对于空单,价差符号相反
if pct < 0
" (" + formatPrice(-priceDiff) + ", +" + str.tostring(-pct, "#.##") + "%)"
else
" (" + formatPrice(-priceDiff) + ", " + str.tostring(-pct, "#.##") + "%)"
else
""
// RSI状态颜色函数
getRSIStatusColor() =>
switch rsiStatus
"动量回升" => // 绿色
"动量回落" => // 红色
"动量中性" => // 黄色
=> // 默认灰色
// 多时间框架趋势颜色函数
getTrendColor(trendDirection) =>
switch trendDirection
"多头倾向" => // 绿色
"空头倾向" => // 红色
"震荡" => // 黄色
=> // 默认灰色
// === 蓝紫科幻风格表格 ===
// 创建蓝紫色主题的表格
var infoTable = table.new(getTablePosition(), columns=2, rows=26,
bgcolor=color.new(#0f0a1a, 5),
border_width=3,
border_color=color.new(#6633ff, 40),
frame_width=2,
frame_color=color.new(#9966ff, 30))
if showTable and barstate.islast
// 确定止盈止损位
var float stopLoss = na
var float takeProfit1 = na
var float takeProfit2 = na
if not na(entryType)
if entryType == "多单"
stopLoss := na(sBot) ? entryPrice * 0.98 : sBot
takeProfit1 := na(rTop) ? entryPrice * 1.02 : rTop
takeProfit2 := entryPrice * 1.05
else if entryType == "空单"
stopLoss := na(rTop) ? entryPrice * 1.02 : rTop
takeProfit1 := na(sBot) ? entryPrice * 0.98 : sBot
takeProfit2 := entryPrice * 0.95
// 计算盈亏比
riskRewardRatio = na(entryPrice) or na(stopLoss) or na(takeProfit1) ? na :
math.abs(takeProfit1 - entryPrice) / math.abs(entryPrice - stopLoss)
riskRewardStr = na(riskRewardRatio) ? "N/A" : "1:" + str.tostring(riskRewardRatio, "#.##")
rowIndex = 0
// === 作者联系信息行 - 最顶部,大字体 ===
table.cell(infoTable, 0, rowIndex, "合作联系作者", text_color=color.new(#ffcc99, 0),
text_size=size.normal, bgcolor=color.new(#1a1a0d, 0))
table.cell(infoTable, 1, rowIndex, "qq2390107445", text_color=color.new(#66ff99, 0),
text_size=size.normal, bgcolor=color.new(#0d2619, 0))
rowIndex += 1
// === 表格标题行 - 蓝紫主题 ===
table.cell(infoTable, 0, rowIndex, "⚡ P6●智能资金概念交易系统", text_color=color.new(#ccccff, 0),
text_size=getTableSize(), bgcolor=color.new(#1a0d33, 0))
table.cell(infoTable, 1, rowIndex, "『" + syminfo.ticker + "』", text_color=color.new(#9966ff, 0),
text_size=size.normal, bgcolor=color.new(#1a0d33, 0))
rowIndex += 1
// === 当前价格与浮盈浮亏行 - 蓝紫主题 ===
unrealizedPnL = calcUnrealizedPnL(entryPrice, close, entryType)
// 浮盈浮亏颜色逻辑
pnlColor = color.new(#ccccff, 0)
pnlBgColor = color.new(#0d0d1a, 0)
if not na(entryPrice)
if entryType == "多单"
if close > entryPrice
pnlColor := color.new(#66ff99, 0)
pnlBgColor := color.new(#0d2619, 0)
else
pnlColor := color.new(#ff6699, 0)
pnlBgColor := color.new(#260d19, 0)
else if entryType == "空单"
if close < entryPrice
pnlColor := color.new(#66ff99, 0)
pnlBgColor := color.new(#0d2619, 0)
else
pnlColor := color.new(#ff6699, 0)
pnlBgColor := color.new(#260d19, 0)
table.cell(infoTable, 0, rowIndex, "当前价格", text_color=color.new(#b3b3ff, 0),
text_size=getTableSize(), bgcolor=color.new(#0d0d1a, 0))
table.cell(infoTable, 1, rowIndex, formatPrice(close) + unrealizedPnL,
text_color=pnlColor,
text_size=getTableSize(), bgcolor=pnlBgColor)
rowIndex += 1
// === 趋势状态与进场价格行 - 蓝紫主题 ===
trendStatus = na(entryType) ? "待机中" : entryType == "多单" ? "多头执行" : "空头执行"
trendIcon = entryType == "多单" ? " ▲" : entryType == "空单" ? " ▼" : " ●"
trendBgColor = entryType == "多单" ? color.new(#1a4d1a, 0) :
entryType == "空单" ? color.new(#4d1a1a, 0) :
color.new(#1a1a4d, 0)
trendTextColor = entryType == "多单" ? color.new(#66ff99, 0) :
entryType == "空单" ? color.new(#ff6699, 0) :
color.new(#9999ff, 0)
table.cell(infoTable, 0, rowIndex, "交易状态", text_color=color.new(#b3b3ff, 0),
text_size=getTableSize(), bgcolor=color.new(#0d0d1a, 0))
table.cell(infoTable, 1, rowIndex, trendStatus + trendIcon, text_color=trendTextColor,
text_size=getTableSize(), bgcolor=trendBgColor)
rowIndex += 1
// === 进场价格行 - 蓝紫主题 ===
table.cell(infoTable, 0, rowIndex, "进场价位", text_color=color.new(#b3b3ff, 0),
text_size=getTableSize(), bgcolor=color.new(#0d0d1a, 0))
table.cell(infoTable, 1, rowIndex, formatPrice(entryPrice),
text_color=color.new(#ffcc99, 0),
text_size=getTableSize(), bgcolor=color.new(#1a1a0d, 0))
rowIndex += 1
// === 多时间框架分析 - 独立行显示 ===
if showMTF
// 多时间框架标题行
table.cell(infoTable, 0, rowIndex, "━━ 多时间框架趋势 ━━", text_color=color.new(#ccccff, 0),
text_size=getTableSize(), bgcolor=color.new(#1a0d33, 0))
table.cell(infoTable, 1, rowIndex, "━━━━━━━━━━━━━━━━━━━━", text_color=color.new(#6633ff, 0),
text_size=getTableSize(), bgcolor=color.new(#1a0d33, 0))
rowIndex += 1
// 1分钟趋势
if mtfEnable1m
= getTrendColor(trend1mDir)
trend1mIcon = trend1mDir == "多头倾向" ? " ▲" : trend1mDir == "空头倾向" ? " ▼" : " ●"
table.cell(infoTable, 0, rowIndex, "1分钟", text_color=color.new(#b3b3ff, 0),
text_size=getTableSize(), bgcolor=color.new(#0d0d1a, 0))
table.cell(infoTable, 1, rowIndex, trend1mDir + trend1mIcon, text_color=trend1mTextColor,
text_size=getTableSize(), bgcolor=trend1mBgColor)
rowIndex += 1
// 5分钟趋势
if mtfEnable5m
= getTrendColor(trend5mDir)
trend5mIcon = trend5mDir == "多头倾向" ? " ▲" : trend5mDir == "空头倾向" ? " ▼" : " ●"
table.cell(infoTable, 0, rowIndex, "5分钟", text_color=color.new(#b3b3ff, 0),
text_size=getTableSize(), bgcolor=color.new(#0d0d1a, 0))
table.cell(infoTable, 1, rowIndex, trend5mDir + trend5mIcon, text_color=trend5mTextColor,
text_size=getTableSize(), bgcolor=trend5mBgColor)
rowIndex += 1
// 15分钟趋势
if mtfEnable15m
= getTrendColor(trend15mDir)
trend15mIcon = trend15mDir == "多头倾向" ? " ▲" : trend15mDir == "空头倾向" ? " ▼" : " ●"
table.cell(infoTable, 0, rowIndex, "15分钟", text_color=color.new(#b3b3ff, 0),
text_size=getTableSize(), bgcolor=color.new(#0d0d1a, 0))
table.cell(infoTable, 1, rowIndex, trend15mDir + trend15mIcon, text_color=trend15mTextColor,
text_size=getTableSize(), bgcolor=trend15mBgColor)
rowIndex += 1
// 1小时趋势
if mtfEnable1h
= getTrendColor(trend1hDir)
trend1hIcon = trend1hDir == "多头倾向" ? " ▲" : trend1hDir == "空头倾向" ? " ▼" : " ●"
table.cell(infoTable, 0, rowIndex, "1小时", text_color=color.new(#b3b3ff, 0),
text_size=getTableSize(), bgcolor=color.new(#0d0d1a, 0))
table.cell(infoTable, 1, rowIndex, trend1hDir + trend1hIcon, text_color=trend1hTextColor,
text_size=getTableSize(), bgcolor=trend1hBgColor)
rowIndex += 1
// 4小时趋势
if mtfEnable4h
= getTrendColor(trend4hDir)
trend4hIcon = trend4hDir == "多头倾向" ? " ▲" : trend4hDir == "空头倾向" ? " ▼" : " ●"
table.cell(infoTable, 0, rowIndex, "4小时", text_color=color.new(#b3b3ff, 0),
text_size=getTableSize(), bgcolor=color.new(#0d0d1a, 0))
table.cell(infoTable, 1, rowIndex, trend4hDir + trend4hIcon, text_color=trend4hTextColor,
text_size=getTableSize(), bgcolor=trend4hBgColor)
rowIndex += 1
// === RSI 动量状态行 - 蓝紫主题 ===
rsiTextColor = color.new(#ccccff, 0)
rsiBgColor = color.new(#0d0d1a, 0)
if rsiStatus == "动量回升"
rsiTextColor := color.new(#66ff99, 0)
rsiBgColor := color.new(#0d2619, 0)
else if rsiStatus == "动量回落"
rsiTextColor := color.new(#ff6699, 0)
rsiBgColor := color.new(#260d19, 0)
else
rsiTextColor := color.new(#ffcc99, 0)
rsiBgColor := color.new(#1a1a0d, 0)
rsiIcon = rsiStatus == "动量回升" ? " ▲" : rsiStatus == "动量回落" ? " ▼" : " ●"
rsiDisplayText = rsiStatus + rsiIcon + " (" + str.tostring(rsiValue, "#.#") + ")"
table.cell(infoTable, 0, rowIndex, "RSI动量", text_color=color.new(#b3b3ff, 0),
text_size=getTableSize(), bgcolor=color.new(#0d0d1a, 0))
table.cell(infoTable, 1, rowIndex, rsiDisplayText, text_color=rsiTextColor,
text_size=getTableSize(), bgcolor=rsiBgColor)
rowIndex += 1
// === 风险管理分割线 ===
table.cell(infoTable, 0, rowIndex, "━━ 风险管理 ━━", text_color=color.new(#ccccff, 0),
text_size=getTableSize(), bgcolor=color.new(#1a0d33, 0))
table.cell(infoTable, 1, rowIndex, "━━━━━━━━━━━━━━━━━━━━", text_color=color.new(#6633ff, 0),
text_size=getTableSize(), bgcolor=color.new(#1a0d33, 0))
rowIndex += 1
// === 止损行 - 蓝紫主题 ===
slPct = calcStopLossPercentage(entryPrice, stopLoss, entryType)
table.cell(infoTable, 0, rowIndex, "止损价位", text_color=color.new(#b3b3ff, 0),
text_size=getTableSize(), bgcolor=color.new(#0d0d1a, 0))
table.cell(infoTable, 1, rowIndex, formatPrice(stopLoss) + slPct,
text_color=color.new(#ff6699, 0),
text_size=getTableSize(), bgcolor=color.new(#330d1a, 0))
rowIndex += 1
// 止盈目标行
if showTargets
// === 目标位1 - 蓝紫主题 ===
tp1Pct = calcTakeProfitPercentage(entryPrice, takeProfit1, entryType)
tp1Reached = na(takeProfit1) ? false :
(entryType == "多单" ? high >= takeProfit1 : low <= takeProfit1)
tp1Icon = tp1Reached ? " ✓" : ""
tp1Color = tp1Reached ? color.new(#66ff99, 0) : color.new(#99ccff, 0)
tp1BgColor = tp1Reached ? color.new(#0d2619, 0) : color.new(#0d1a26, 0)
table.cell(infoTable, 0, rowIndex, "止盈目标1", text_color=color.new(#b3b3ff, 0),
text_size=getTableSize(), bgcolor=color.new(#0d0d1a, 0))
table.cell(infoTable, 1, rowIndex, formatPrice(takeProfit1) + tp1Pct + tp1Icon,
text_color=tp1Color,
text_size=getTableSize(), bgcolor=tp1BgColor)
rowIndex += 1
// === 目标2 - 蓝紫主题 ===
tp2Pct = calcTakeProfitPercentage(entryPrice, takeProfit2, entryType)
tp2Reached = na(takeProfit2) ? false :
(entryType == "多单" ? high >= takeProfit2 : low <= takeProfit2)
tp2Icon = tp2Reached ? " ✓" : ""
tp2Color = tp2Reached ? color.new(#66ff99, 0) : color.new(#cc99ff, 0)
tp2BgColor = tp2Reached ? color.new(#0d2619, 0) : color.new(#1a0d26, 0)
table.cell(infoTable, 0, rowIndex, "止盈目标2", text_color=color.new(#b3b3ff, 0),
text_size=getTableSize(), bgcolor=color.new(#0d0d1a, 0))
table.cell(infoTable, 1, rowIndex, formatPrice(takeProfit2) + tp2Pct + tp2Icon,
text_color=tp2Color,
text_size=getTableSize(), bgcolor=tp2BgColor)
rowIndex += 1
// === 盈亏比行 - 蓝紫主题 ===
if showRatio
rrColor = color.new(#9999ff, 0)
rrBgColor = color.new(#0d0d1a, 0)
if not na(riskRewardRatio)
if riskRewardRatio >= 2
rrColor := color.new(#66ff99, 0)
rrBgColor := color.new(#0d2619, 0)
else if riskRewardRatio >= 1
rrColor := color.new(#ffcc99, 0)
rrBgColor := color.new(#1a1a0d, 0)
else
rrColor := color.new(#ff9966, 0)
rrBgColor := color.new(#1a1a0d, 0)
table.cell(infoTable, 0, rowIndex, "盈亏比例", text_color=color.new(#b3b3ff, 0),
text_size=getTableSize(), bgcolor=color.new(#0d0d1a, 0))
table.cell(infoTable, 1, rowIndex, riskRewardStr,
text_color=rrColor,
text_size=getTableSize(), bgcolor=rrBgColor)
rowIndex += 1
// === 免责声明行 - 蓝紫主题 ===
table.cell(infoTable, 0, rowIndex, "⚠ 风险提示", text_color=color.new(#9999ff, 0),
text_size=size.small, bgcolor=color.new(#0d0d1a, 0))
table.cell(infoTable, 1, rowIndex, "仅供参考,不构成投资建议,盈亏自负",
text_color=color.new(#9999ff, 0),
text_size=size.small, bgcolor=color.new(#1a1a4d, 0))

VB-MainLiteVB-MainLite – v1.0 Initial Release
Overview
VB-MainLite is a consolidated market-structure and execution framework designed to streamline decision-making into a single chart-level view. The script combines multi-timeframe trend, volatility, volume, and liquidity signals into one cohesive visual layer, reducing indicator clutter while preserving depth of information for active traders.
Core Architecture
Trend Backbone – EMA 200
Dedicated EMA 200 acts as the primary trend filter and higher-timeframe bias reference.
Serves as the “spine” of the system for contextualizing all secondary signals (swings, reversals, volume events, etc.).
Custom MA Suite (Envelope Ready)
Four configurable moving averages with flexible source, length, and smoothing.
Default configuration (preset idea: “8/89 Envelope”):
MA #1: EMA 8 on high
MA #2: EMA 8 on low
MA #3: EMA 89 on high
MA #4: EMA 89 on low
All four are disabled by default to keep the chart minimal. Users can toggle them on from the Custom MAs group for envelope or cloud-style configurations.
Nadaraya–Watson Smoother (Swing Framework)
Gaussian-kernel Nadaraya–Watson regression applied to price (hl2) to build a smooth synthetic curve.
Two layers of functionality:
Swing labels (▲ / ▼) at inflection points in the smoothed curve.
Optional curve line that visually tracks the turning structure over the last ~500 bars.
Designed to surface early swing potential before standard MAs react.
Hull Moving Average (Trend Overlay)
Optional Hull MA (HMA) for faster trend visualization.
Color-coded by slope (buy/sell bias).
Default: off to prevent overloading the chart; can be enabled under Hull MA settings.
Momentum, Exhaustion & Pattern Engine
CCI-Based Bar Coloring
CCI applied to close with configurable thresholds.
Overbought / oversold CCI zones map directly into candle coloring to visually highlight short-term momentum extremes.
RSI Top / Bottom Exhaustion Finder
RSI logic applied separately to high-driven (tops) and low-driven (bottoms) sequences.
Plots:
Top arrows where high-side RSI stretches into high-risk territory.
Bottom arrows where low-side RSI indicates exhaustion on the downside.
Useful as confluence around the Nadaraya swing turns and EMA 200 regime.
Engulfing + MA Trend Engine (“Fat Bull / Fat Bear”)
Detects bullish and bearish engulfing patterns, then combines them with MA trend cross logic.
Only when both pattern and MA regime align does the engine flag:
Fat Bull (Engulf + MA aligned long)
Fat Bear (Engulf + MA aligned short)
Candles are marked via conditional barcolor to highlight strong, structured shifts in control.
Fat Finger Detection (Wick Spikes / Stop Runs)
Identifies abnormal wick extensions relative to the prior bar’s body range with configurable tolerance.
Supports detection of potential liquidity grabs, stop runs, or “excess” that may precede reversals or mean-reversion behavior.
Volume & Liquidity Intelligence
Bull Snort (Aggressive Buy Spikes)
Flags events where:
Volume is significantly above the 50-period average, and
Price closes in the upper portion of the bar and above prior close.
Plots a labeled marker below the bar to indicate aggressive upside initiative by buyers.
Pocket Pivots (Accumulation Flags)
Compares current volume vs prior 10 sessions with a filter on prior “up” days.
Highlights pocket pivot days where current green candle volume outclasses recent down-day volumes, suggesting stealth accumulation.
Delta Volume Core (Directional Volume by Price)
Internal volume-by-price style engine over a user-defined lookback.
Splits volume into up-close and down-close buckets across dynamic price bins.
Feeds into S&R and ICT zone logic to quantify where buying vs selling pressure built up.
Structural Context: S&R and ICT Zones
S&R Power Channel
Computes local high/low band over a configurable lookback window.
Renders:
Upper and lower S&R channel lines.
Shaded support / resistance zones using boxes.
Adds Buy Power / Sell Power metrics based on the ratio of up vs down bars inside the window, displayed directly in the zone overlays.
Drops ◈ markers where price interacts dynamically with the top or bottom band, highlighting reaction points.
ICT-Style Premium / Discount & Macro Zones
Two tiered structures:
Local Premium / Discount zones over a shorter SR window.
Macro Premium / Discount zones over a longer macro window.
Each zone:
Uses underlying directional volume to annotate accumulation vs distribution bias.
Provides Delta Volume Bias shading in the mid-band region, visually encoding whether local power flows are net-buying or net-selling.
Enables traders to quickly see whether current trade location is in a local/macro discount or premium context while still respecting volume profile.
Positioning Intelligence: PCD (Stocks)
Position Cost Distribution (PCD) – Stocks Only
Available for stock symbols on intraday up to daily timeframe (≤ 1D).
Uses:
TOTAL_SHARES_OUTSTANDING fundamentals,
Daily OHLCV snapshot, and
A bucketed distribution engine
to approximate cost basis distribution across price.
Outputs:
Horizontal “PCD bars” to the right of current price, density-scaled by estimated share concentration.
Color-coding by profitability relative to current price (profitable vs unprofitable positions).
Labels for:
Current price
Average cost
Profit ratio (share % below current price)
90% cost range
70% cost range
Range overlap as a measure of clustering / concentration.
Multi-Timeframe Trend: Two-Pole Gaussian Dashboard
Two-Pole Gaussian Filter (Line + Cloud)
Smooths a user-selected source (default: close) using a two-pole Gaussian filter with tunable alpha.
Plots:
A thin Gaussian trend line, and
A thick Gaussian “cloud” line with transparency, colored by slope vs past (offsetG).
Functions as a responsive trend backbone that is more sensitive than EMA 200 but less noisy than raw price.
Multi-Timeframe Gaussian Dashboard
Evaluates Gaussian trend direction across up to six timeframes (e.g., 1H / 2H / 4H / Daily / Weekly).
Renders a compact bottom-right table:
Header: symbol + overall bias arrow (up / down) based on average trend alignment.
Row of colored cells per timeframe (green for uptrend, magenta for downtrend) with human-readable TF labels (e.g., “60M”, “4H”, “1D”).
Gives an immediate read on whether intraday, swing, and higher-timeframe flows are aligned or fragmented.
Default Configuration & Usage Guidance
Default state after adding the script:
Enabled by default:
EMA 200 trend backbone
Nadaraya–Watson swing labels and curve
CCI bar coloring
RSI top/bottom arrows
Fat Bull / Fat Bear engine
Bull Snort & Pocket Pivots
S&R Power Channel
ICT Local + Macro zones
Two-pole Gaussian line + cloud + dashboard
PCD engine for stocks (auto-active where data is available)
Disabled by default (opt-in):
Custom MA suite (4x MAs, preset as EMA 8/8/89/89)
Hull MA overlay
How traders can use VB-MainLite in practice:
Use EMA 200 + Gaussian dashboard to define top-down directional bias and avoid trading directly against multi-TF trend.
Use Nadaraya swing labels, RSI exhaustion arrows, and CCI bar colors to time entries within that higher-timeframe bias.
Use Fat Bull / Fat Bear events as structured confirmation that both pattern and MA regime have flipped in the same direction.
Use Bull Snort, Pocket Pivots, and S&R / ICT zones to align execution with liquidity, volume, and location (premium vs discount).
On stocks, use PCD as a positioning map to understand trapped supply, support zones near crowded cost basis, and where profit-taking is likely.

缠中禅V6Pro"ChanLun" is a highly regarded technical analysis method originating in China. Since its introduction in 2006, ChanLun has quickly gained significant attention and a strong following in the Chinese trading community due to its remarkable ability to navigate complex market dynamics.
ChanLun places great emphasis on market structure, price action, momentum, and the intricate interactions between market forces. It recognizes that the market operates in cyclical patterns and aims to capture the underlying structure and rhythm of price movements. Through detailed analysis of the intricate relationship between price and time, it provides traders with a unique perspective on market trends, potential reversals, and key turning points.
🟠 Algorithm
🔵 Step 1: Candlestick Conversion
In ChanLun, candlestick analysis pays less attention to the opening/closing prices and wicks, focusing instead on the range that the stock price reaches. Therefore, the first step in ChanLun involves converting each candlestick to include only the high and low prices, ignoring other elements.
🔵 Step 2: Candlestick Standardization
In the second step, the converted candlesticks are standardized to ensure strict directional consistency and to eliminate the presence of inner or outer bars. For any two adjacent candlesticks A and B, if one price range completely contains the other, A and B are merged into a new candlestick C. If A is in an uptrend from the previous candlestick, C is defined as High(C) = max(High(A), High(B)) and Low(C) = max(Low(A), Low(B)). If A is in a downtrend from the previous candlestick, C is defined as High(C) = min(High(A), High(B)) and Low(C) = min(Low(A), Low(B)).
After completing these steps, when considering any adjacent candlesticks A and B, we can always observe one of the following conditions:
1. High(A) > High(B) and Low(A) > Low(B)
2. High(A) < High(B) and Low(A) < Low(B)
The diagram below illustrates how the candlesticks are displayed after this step.
🔵 Step 3: Fractals
A "fractal" refers to a pattern formed by three consecutive "normalized" candlesticks, where the middle candlestick shows significantly higher or lower values compared to the surrounding candlesticks. When considering three adjacent candlesticks A, B, and C, we have one of two conditions:
1. High (B) > High (A) and High (B) > High (C) and Low (B) > Low (A) and Low (B) > Low (C)
2。 High (B) < Low (A) and High (B) < Low (C) and Low (B) < Low (A) and Low (B) < Low (C) For
In #1 above, we refer to the combination of A, B, and C as the "top fractal", while for #2 we specify it as the "bottom fractal".
The image below illustrates all fractals, with the red triangle indicating the top fractal and the green triangle indicating the bottom splitting.
🔵 Step 4: Strokes
A "stroke" is a line that connects the top fractal and the bottom fractal, following these rules:
1. There must be at least one "free" candlestick between these fractals, which means it is not part of the top or bottom split. This guarantees that the stroke contains at least five candlesticks from start to finish.
2. The top fractal must have a higher price compared to the bottom fractal.
3. The end fractal should represent the highest or lowest point within the entire stroke range. (There is an option in this indicator to enable or disable this rule.)
Brushstrokes enable traders to identify and visualize significant price movements or trends while effectively filtering out minor fluctuations.
🔵 Step 5: Segmentation
A "subdivision" is a higher-level line that connects the start and end points of at least three consecutive strokes, reflecting the trend of the current market structure. As new strokes emerge, it continues to extend until there is a break in the market structure. A breakout occurs when an uptrend forms lower highs and lower lows, or when a downtrend forms higher highs and higher lows. It is important to note that within the trading range, the brushstrokes typically exhibit higher highs and lower lows or higher lows and lower highs patterns (similar to the inner and outer bars). In this case, the brushstrokes will merge in a similar manner to the candlesticks described earlier until there is a clear breakout in the market structure. Contrary to brushstrokes, segments provide a relatively stable depiction of market trends on higher time frames.
It is important to note that the algorithm used to calculate line segments from strokes can again be applied recursively to the generated line segments, forming higher-level line segments that represent market trends over a larger time frame.
🔵 Step 6: Pivot
In ChanLun, the term "pivot" does not represent a price reversal point. Instead, it refers to a trading range where the security's price tends to fluctuate. Within a given "Segment," a pivot is determined by the overlap of two consecutive strokes moving in opposite directions along the segment. When two downward trend strokes, A and B, form a pivot P within an upward trend segment S, the upper and lower boundaries of the pivot are defined as follows:
1. Upper limit (P) = min(high(A), high(B))
2. Lower limit (P) = max(low(A), low(B))
The pivot range is usually where consolidation and high trading volume occur.
If future strokes moving in the opposite direction along the current segment overlap with the upper and lower boundaries of the pivot, those strokes will merge into the existing pivot, extending it along the x-axis. A new pivot is formed when two consecutive strokes moving in the opposite direction along the current segment intersect each other without overlapping the previous pivot.
Similarly, pivots can be recursively identified in higher-level segments. The blue boxes below indicate "Segment Pivots" identified in the context of higher-level segments.
🔵 Step 7: Buy/Sell Points
ChanLun defines three types of buy/sell points.
1. Type 1 Buy and Sell Points: Also called trend reversal points. These points mark where an old segment ends and a new segment begins.
2. Type 2 Buy and Sell Points: Also called trend continuation points. These points occur when the price is in a trend, indicating trend continuation. In an uptrend, Type 2 buy points are rebound points after the price retraces to previous lows or support levels, signaling a likely continuation of the upward movement. In a downtrend, Type 2 sell points are pullback points after the price bounces to previous highs or resistance levels, signaling a likely continuation of the downward movement.
3. Type 3 Buy and Sell Points: These points represent retests of a pivot range breakout. The presence of these retest points indicates that the price may continue to move up/down above/below the pivot level.
Astute readers may notice that these buy/sell points are lagging indicators. For example, multiple candlesticks will have occurred by the time a new segment is confirmed at a Type 1 buy/sell point in that segment. In fact, buy/sell points do lag behind actual market movements. However, ChanLun addresses this issue through multi-timeframe analysis. By examining buy/sell points confirmed in lower timeframes, additional confidence can be gained in determining the overall trend of higher timeframes.
🔵 Step 8: Divergence
Another core technique in ChanLun is using divergence to predict the occurrence of Type 1 buy/sell points. While MACD is the most commonly used indicator for detecting divergence, other indicators like RSI can also serve this purpose.
🟠 Summary
Essentially, ChanLun is a powerful technical analysis method that combines careful examination and interpretation of price charts, the application of technical indicators and quantitative tools, and keen attention to multiple timeframes. Its goal is to identify current market trends and uncover potential trading opportunities. What sets ChanLun apart is its holistic approach, which integrates both qualitative and quantitative analysis to facilitate informed and successful trading decisions.
“缠论”是一种起源于中国的备受推崇的技术分析方法。自 2006 年推出以来,ChanLun 凭借其驾驭复杂市场动态的非凡能力,迅速在中国交易社区中获得了极大的关注和强大的追随者。
ChanLun 非常重视市场结构、价格行为、动量以及市场力量之间错综复杂的相互作用。它认识到市场以周期性模式运作,旨在捕捉价格变动的底层结构和节奏。通过对价格和时间之间错综复杂的关系的细致分析,它为交易者提供了关于市场趋势、潜在逆转和关键转折点的独特视角。
该指标提供了 ChanLun 理论的细致而全面的实施。它有助于对所有基本组成部分进行深入分析和可视化表示,包括 “Candlestick Conversion”, “Candlestick Standardization”, “Fractal”, “Stroke”, “Segment”, “Pivot” 和 “Buying/Selling Point”。
🟠 算法
🔵 1 步:烛台转换
在 ChanLun 中,烛台分析较少关注开盘价/收盘价和灯芯,而是强调股价达到的价格范围。因此,ChanLun 的第一步涉及将每根烛条转换为仅包含最高价和最低价,而忽略其他元素。
🔵 第 2 步:烛台标准化
在第二步中,对转换后的烛台进行标准化,以确保严格的方向一致性,并消除内柱线或外柱线的存在。对于任何相邻的两根烛条 A 和 B,其中一根的价格范围完全包含另一根,A 和 B 被合并为新的烛条 C。如果 A 从前一根蜡烛开始呈上升趋势,则 C 将被定义为最高价 (C) = 最大值(最高价 (A), 最高价 (B)) 和最低价 (C) = 最大值(最低价 (A), 最低价 (B))。如果 A 从前一根蜡烛开始呈下降趋势,则 C 将被定义为最高价 (C) = min(最高价 (A), 最高价 (B)) 和最低价 (C) = min(最低价 (A), 最低价 (B))。
完成这些步骤后,在考虑任何相邻的烛条 A 和 B 时,我们始终可以观察到以下任一条件:
1. 最高价 (A) > 最高价 (B) 和最低价 (A) >最低价 (B)
2。最高价 (A) <最高价 (B) 和最低价 (A) <最低价 (B)
下图说明了此步骤后烛台的显示方式。
🔵 第 3 步:分形
“分形”是指由三个连续的“标准化”烛台形成的形态,其中中间的烛台与周围的烛台相比显示出明显的更高或更低的值。当考虑三个相邻的烛台 A、B 和 C 时,我们有以下两个条件之一:
1. 最高价 (B) > 最高价 (A) 和高点 (B) >最高价 (C) 和最低价 (B) >最低价 (A) 和最低价 (B) >最低价 (C)
2。高 (B) < 低 (A) 和高 (B) < 低 (C) 和低 (B) < 低 (A) 和低 (B) < 低 (C)对于
上面的 #1,我们将 A、B 和 C 的组合称为“顶部分形”,而对于 #2,我们将其指定为“底部分形”。
下图说明了所有分形,其中红色三角形表示顶部分形,绿色三角形表示底部分形。
🔵 第 4 步:笔画
“笔画” 是连接顶部分形和底部分形的一条线,遵循以下规则:
1. 在这些分形之间必须至少有一个 “自由” 烛台,这意味着它不是顶部或底部分形的一部分。这保证了笔画从头到尾至少包含五根烛条。
2. 与底部分形相比,顶部分形必须具有更高的价格。
3. 端点分形应表示整个笔画范围内的最高点或最低点。(此指示器中有一个选项用于启用或禁用此规则。
笔触使交易者能够识别和可视化重大的价格波动或趋势,同时有效地过滤掉微小的波动。
🔵 第 5 步:细分
“细分”是一条更高级别的线,连接至少连续三个笔画的起点和终点,反映了当前市场结构的趋势。随着新笔触的出现,它继续延伸,直到市场结构出现中断。当上升趋势形成较低的高点和较低的低点,或者当下降趋势形成更高的高点和更高的低点时,就会发生突破。值得注意的是,在交易区间内,笔触通常表现出更高的高点和更低的低点或更高的低点和更低的高点形态(类似于内柱和外柱)。在这种情况下,笔触将以与前面描述的烛台类似的方式合并,直到市场结构出现明显的突破。与笔触相反,分段在更高的时间范围内提供了对市场趋势的相对稳定的描述。
需要注意的是,用于从笔画计算线段的算法可以再次递归地应用于生成的线段,形成更高级别的线段,代表更大时间范围内的市场趋势。
🔵 第 6 步:枢轴
在 ChanLun 中,“枢轴”一词并不表示价格反转点。相反,它代表证券价格趋于波动的交易区间。在给定的 “Segment” 中,枢轴由沿线段相反方向移动的两个连续笔画的重叠决定。当两个下降趋势笔触 A 和 B 在上升趋势段 S 内形成枢轴 P 时,枢轴的上限和下限定义如下:
1. 上限 (P) = min(最高 (A), 最高 (
pein:
B)
2. 下限 (P) = 最大值(最低 (A), 最低 (B))
枢轴范围通常是发生盘整和交易量高的地方。
如果沿当前线段的相反方向移动的未来笔触与枢轴的上限和下限重叠,则该笔划将合并到现有枢轴中,并沿 x 轴延伸枢轴。当沿当前线段的相反方向移动的两个连续笔触彼此相交而不与前一个轴重叠时,将形成新的枢轴。
同样,也可以在更高级别的 segment 中递归识别 pivots。下面的蓝色框表示在更高级别区段的上下文中标识的“Segment Pivots”。
🔵 第 7 步:购买/出售积分
ChanLun 中定义了三种类型的购买/出售积分。
1. 类型 1 买入和卖出点:也称为趋势反转点。这些点是旧路段终止和生成新路段的位置。
2. 类型 2 买入和卖出点:也称为趋势延续点。这些点发生在价格处于趋势中时,标志着趋势的延续。在上升趋势中,类型 2 买点是价格回撤至先前低点或支撑位后的反弹点,表明价格可能会继续上涨。在下跌趋势中,类型 2 卖点是价格反弹至前高点或阻力位后的回调点,表明价格可能会继续下跌。
3. 类型 3 买入和卖出点:这些点表示对枢轴范围突破的重新测试。这些重新测试点的存在表明,价格有可能在枢轴水平上方/下方继续向上/向下移动。
挑剔的读者可能会注意到这些买入/卖出点是滞后指标。例如,当确认新区段时,自该区段的类型 1 买入/卖出点以来已经发生了多根烛台。
事实上,买入/卖出点确实落后于实际市场走势。然而,ChanLun 通过使用多时间框架分析解决了这个问题。通过检查较低时间框架中确认的买入/卖出点,可以在确定较高时间框架的整体趋势方面获得额外的信心。
🔵 第 8 步:背离
ChanLun 的另一个核心技术是应用背离来预测 1 型买入/卖出点的出现。虽然 MACD 是检测背离最常用的指标,但 RSI 等其他指标也可用于此目的。
🟠 总结
从本质上讲,ChanLun 是一种强大的技术分析方法,它结合了对价格图表的仔细检查和解释、技术指标和定量工具的应用以及对多个时间框架的敏锐关注。其目标是确定当前的市场趋势并发现潜在的交易前景。ChanLun 的与众不同之处在于其整体方法,该方法融合了定性和定量分析,以促进明智和成功的交易决策。

Kernel Market Dynamics [WFO - MAB]Kernel Market Dynamics
⚛️ CORE INNOVATION: KERNEL-BASED DISTRIBUTION ANALYSIS
The Kernel Market Dynamics system represents a fundamental departure from traditional technical indicators. Rather than measuring price levels, momentum, or oscillator extremes, KMD analyzes the statistical distribution of market returns using advanced kernel methods from machine learning theory. This allows the system to detect when market behavior has fundamentally changed—not just when price has moved, but when the underlying probability structure has shifted.
The Distribution Hypothesis:
Traditional indicators assume markets move in predictable patterns. KMD assumes something more profound: markets exist in distinct distributional regimes , and profitable trading opportunities emerge during regime transitions . When the distribution of recent returns diverges significantly from the historical baseline, the market is restructuring—and that's when edge exists.
Maximum Mean Discrepancy (MMD):
At the heart of KMD lies a sophisticated statistical metric called Maximum Mean Discrepancy. MMD measures the distance between two probability distributions by comparing their representations in a high-dimensional feature space created by a kernel function.
The Mathematics:
Given two sets of normalized returns:
• Reference period (X) : Historical baseline (default 100 bars)
• Test period (Y) : Recent behavior (default 20 bars)
MMD is calculated as:
MMD² = E + E - 2·E
Where:
• E = Expected kernel similarity within reference period
• E = Expected kernel similarity within test period
• E = Expected cross-similarity between periods
When MMD is low : Test period behaves like reference (stable regime)
When MMD is high : Test period diverges from reference (regime shift)
The final MMD value is smoothed with EMA(5) to reduce single-bar noise while maintaining responsiveness to genuine distribution changes.
The Kernel Functions:
The kernel function defines how similarity is measured. KMD offers four mathematically distinct kernels, each with different properties:
1. RBF (Radial Basis Function / Gaussian):
• Formula: k(x,y) = exp(-d² / (2·σ²·scale))
• Properties: Most sensitive to distribution changes, smooth decision boundaries
• Best for: Clean data, clear regime shifts, low-noise markets
• Sensitivity: Highest - detects subtle changes
• Use case: Stock indices, major forex pairs, trending environments
2. Laplacian:
• Formula: k(x,y) = exp(-|d| / σ)
• Properties: Medium sensitivity, robust to moderate outliers
• Best for: Standard market conditions, balanced noise/signal
• Sensitivity: Medium - filters minor fluctuations
• Use case: Commodities, standard timeframes, general trading
3. Cauchy (Default - Most Robust):
• Formula: k(x,y) = 1 / (1 + d²/σ²)
• Properties: Heavy-tailed, highly robust to outliers and spikes
• Best for: Noisy markets, choppy conditions, crypto volatility
• Sensitivity: Lower - only major distribution shifts trigger
• Use case: Cryptocurrencies, illiquid markets, volatile instruments
4. Rational Quadratic:
• Formula: k(x,y) = (1 + d²/(2·α·σ²))^(-α)
• Properties: Tunable via alpha parameter, mixture of RBF kernels
• Alpha < 1.0: Heavy tails (like Cauchy)
• Alpha > 3.0: Light tails (like RBF)
• Best for: Adaptive use, mixed market conditions
• Use case: Experimental optimization, regime-specific tuning
Bandwidth (σ) Parameter:
The bandwidth controls the "width" of the kernel, determining sensitivity to return differences:
• Low bandwidth (0.5-1.5) : Narrow kernel, very sensitive
- Treats small differences as significant
- More MMD spikes, more signals
- Use for: Scalping, fast markets
• Medium bandwidth (1.5-3.0) : Balanced sensitivity (recommended)
- Filters noise while catching real shifts
- Professional-grade signal quality
- Use for: Day/swing trading
• High bandwidth (3.0-10.0) : Wide kernel, less sensitive
- Only major distribution changes register
- Fewer, stronger signals
- Use for: Position trading, trend following
Adaptive Bandwidth:
When enabled (default ON), bandwidth automatically scales with market volatility:
Effective_BW = Base_BW × max(0.5, min(2.0, 1 / volatility_ratio))
• Low volatility → Tighter bandwidth (0.5× base) → More sensitive
• High volatility → Wider bandwidth (2.0× base) → Less sensitive
This prevents signal flooding during wild markets and avoids signal drought during calm periods.
Why Kernels Work:
Kernel methods implicitly map data to infinite-dimensional space where complex, nonlinear patterns become linearly separable. This allows MMD to detect distribution changes that simpler statistics (mean, variance) would miss. For example:
• Same mean, different shape : Traditional metrics see nothing, MMD detects shift
• Same volatility, different skew : Oscillators miss it, MMD catches it
• Regime rotation : Price unchanged, but return distribution restructured
The kernel captures the entire distributional signature —not just first and second moments.
🎰 MULTI-ARMED BANDIT FRAMEWORK: ADAPTIVE STRATEGY SELECTION
Rather than forcing one strategy on all market conditions, KMD implements a Multi-Armed Bandit (MAB) system that learns which of seven distinct strategies performs best and dynamically selects the optimal approach in real-time.
The Seven Arms (Strategies):
Each arm represents a fundamentally different trading logic:
ARM 0 - MMD Regime Shift:
• Logic: Distribution divergence with directional bias
• Triggers: MMD > threshold AND direction_bias confirmed AND velocity > 5%
• Philosophy: Trade the regime transition itself
• Best in: Volatile shifts, breakout moments, crisis periods
• Weakness: False alarms in choppy consolidation
ARM 1 - Trend Following:
• Logic: Aligned EMAs with strong ADX
• Triggers: EMA(9) > EMA(21) > EMA(50) AND ADX > 25
• Philosophy: Ride established momentum
• Best in: Strong trending regimes, directional markets
• Weakness: Late entries, whipsaws at reversals
ARM 2 - Breakout:
• Logic: Bollinger Band breakouts with volume
• Triggers: Price crosses BB outer band AND volume > 1.2× average
• Philosophy: Capture volatility expansion events
• Best in: Range breakouts, earnings, news events
• Weakness: False breakouts in ranging markets
ARM 3 - RSI Mean Reversion:
• Logic: RSI extremes with reversal confirmation
• Triggers: RSI < 30 with uptick OR RSI > 70 with downtick
• Philosophy: Fade overbought/oversold extremes
• Best in: Ranging markets, mean-reverting instruments
• Weakness: Fails in strong trends, catches falling knives
ARM 4 - Z-Score Statistical Reversion:
• Logic: Price deviation from 50-period mean
• Triggers: Z-score < -2 (oversold) OR > +2 (overbought) with reversal
• Philosophy: Statistical bounds reversion
• Best in: Stable volatility regimes, pairs trading
• Weakness: Trend continuation through extremes
ARM 5 - ADX Momentum:
• Logic: Strong directional movement with acceleration
• Triggers: ADX > 30 with DI+ or DI- strengthening
• Philosophy: Momentum begets momentum
• Best in: Trending with increasing velocity
• Weakness: Late exits, momentum exhaustion
ARM 6 - Volume Confirmation:
• Logic: OBV trend + volume spike + candle direction
• Triggers: OBV > EMA(20) AND volume > average AND bullish candle
• Philosophy: Follow institutional money flow
• Best in: Liquid markets with reliable volume
• Weakness: Manipulated volume, thin markets
Q-Learning with Rewards:
Each arm maintains a Q-value representing its expected reward. After every bar, the system calculates a reward based on the arm's signal and actual price movement:
Reward Calculation:
If arm signaled LONG:
reward = (close - close ) / close
If arm signaled SHORT:
reward = -(close - close ) / close
If arm signaled NEUTRAL:
reward = 0
Penalty multiplier: If loss > 0.5%, reward × 1.3 (punish big losses harder)
Q-Value Update (Exponential Moving Average):
Q_new = Q_old + α × (reward - Q_old)
Where α (learning rate, default 0.08) controls adaptation speed:
• Low α (0.01-0.05): Slow, stable learning
• Medium α (0.06-0.12): Balanced (recommended)
• High α (0.15-0.30): Fast, reactive learning
This gradually shifts Q-values toward arms that generate positive returns and away from losing arms.
Arm Selection Algorithms:
KMD offers four mathematically distinct selection strategies:
1. UCB1 (Upper Confidence Bound) - Recommended:
Formula: Select arm with max(Q_i + c·√(ln(t)/n_i))
Where:
• Q_i = Q-value of arm i
• c = exploration constant (default 1.5)
• t = total pulls across all arms
• n_i = pulls of arm i
Philosophy: Balance exploitation (use best arm) with exploration (try uncertain arms). The √(ln(t)/n_i) term creates an "exploration bonus" that decreases as an arm gets more pulls, ensuring all arms get sufficient testing.
Theoretical guarantee: Logarithmic regret bound - UCB1 provably converges to optimal arm selection over time.
2. UCB1-Tuned (Variance-Aware UCB):
Formula: Select arm with max(Q_i + √(ln(t)/n_i × min(0.25, V_i + √(2·ln(t)/n_i))))
Where V_i = variance of rewards for arm i
Philosophy: Incorporates reward variance into exploration. Arms with high variance (unpredictable) get less exploration bonus, focusing effort on stable performers.
Better bounds than UCB1 in practice, slightly more conservative exploration.
3. Epsilon-Greedy (Simple Random):
Algorithm:
With probability ε: Select random arm (explore)
With probability 1-ε: Select highest Q-value arm (exploit)
Default ε = 0.10 (10% exploration, 90% exploitation)
Philosophy: Simplest algorithm, easy to understand. Random exploration ensures all arms stay updated but may waste time on clearly bad arms.
4. Thompson Sampling (Bayesian):
The most sophisticated selection algorithm, using true Bayesian probability.
Each arm maintains Beta distribution parameters:
• α (alpha) = successes + 1
• β (beta) = failures + 1
Selection Process:
1. Sample θ_i ~ Beta(α_i, β_i) for each arm using Marsaglia-Tsang Gamma sampler
2. Select arm with highest sample: argmax_i(θ_i)
3. After reward, update:
- If reward > 0: α += |reward| × 100 (increment successes)
- If reward < 0: β += |reward| × 100 (increment failures)
Why Thompson Sampling Works:
The Beta distribution naturally represents uncertainty about an arm's true win rate. Early on with few trials, the distribution is wide (high uncertainty), leading to more exploration. As evidence accumulates, it narrows around the true performance, naturally shifting toward exploitation.
Unlike UCB which uses deterministic confidence bounds, Thompson Sampling is probabilistic—it samples from the posterior distribution of each arm's success rate, providing automatic exploration/exploitation balance without tuning.
Comparison:
• UCB1: Deterministic, guaranteed regret bounds, requires tuning exploration constant
• Thompson: Probabilistic, natural exploration, no tuning required, best empirical performance
• Epsilon-Greedy: Simplest, consistent exploration %, less efficient
• UCB1-Tuned: UCB1 + variance awareness, best for risk-averse
Exploration Constant (c):
For UCB algorithms, this multiplies the exploration bonus:
• Low c (0.5-1.0): Strongly prefer proven arms, rare exploration
• Medium c (1.2-1.8): Balanced (default 1.5)
• High c (2.0-3.0): Frequent exploration, diverse arm usage
Higher exploration constant in volatile/unstable markets, lower in stable trending environments.
🔬 WALK-FORWARD OPTIMIZATION: PREVENTING OVERFITTING
The single biggest problem in algorithmic trading is overfitting—strategies that look amazing in backtest but fail in live trading because they learned noise instead of signal. KMD's Walk-Forward Optimization system addresses this head-on.
How WFO Works:
The system divides time into repeating cycles:
1. Training Window (default 500 bars): Learn arm Q-values on historical data
2. Testing Window (default 100 bars): Validate on unseen "future" data
Training Phase:
• All arms accumulate rewards and update Q-values normally
• Q_train tracks in-sample performance
• System learns which arms work on historical data
Testing Phase:
• System continues using arms but tracks separate Q_test metrics
• Counts trades per arm (N_test)
• Testing performance is "out-of-sample" relative to training
Validation Requirements:
An arm is only "validated" (approved for live use) if:
1. N_test ≥ Minimum Trades (default 10): Sufficient statistical sample
2. Q_test > 0 : Positive out-of-sample performance
Arms that fail validation are blocked from generating signals, preventing the system from trading strategies that only worked on historical data.
Performance Decay:
At the end of each WFO cycle, all Q-values decay exponentially:
Q_new = Q_old × decay_rate (default 0.95)
This ensures old performance doesn't dominate forever. An arm that worked 10 cycles ago but fails recently will eventually lose influence.
Decay Math:
• 0.95 decay after 10 periods → 0.95^10 = 0.60 (40% forgotten)
• 0.90 decay after 10 periods → 0.90^10 = 0.35 (65% forgotten)
Fast decay (0.80-0.90): Quick adaptation, forgets old patterns rapidly
Slow decay (0.96-0.99): Stable, retains historical knowledge longer
WFO Efficiency Metric:
The key metric revealing overfitting:
Efficiency = (Q_test / Q_train) for each validated arm, averaged
• Efficiency > 0.8 : Excellent - strategies generalize well (LOW overfit risk)
• Efficiency 0.5-0.8 : Acceptable - moderate generalization (MODERATE risk)
• Efficiency < 0.5 : Poor - strategies curve-fitted to history (HIGH risk)
If efficiency is low, the system has learned noise. Training performance was good but testing (forward) performance is weak—classic overfitting.
The dashboard displays real-time WFO efficiency, allowing users to gauge system robustness. Low efficiency should trigger parameter review or reduced position sizing.
Why WFO Matters:
Consider two scenarios:
Scenario A - No WFO:
• Arm 3 (RSI Reversion) shows Q-value of 0.15 on all historical data
• System trades it aggressively
• Reality: It only worked during one specific ranging period
• Live trading: Fails because market has trended since backtest
Scenario B - With WFO:
• Arm 3 shows Q_train = 0.15 (good in training)
• But Q_test = -0.05 (loses in testing) with 12 test trades
• N_test ≥ 10 but Q_test < 0 → Arm BLOCKED
• System refuses to trade it despite good backtest
• Live trading: Protected from false strategy
WFO ensures only strategies that work going forward get used, not just strategies that fit the past.
Optimal Window Sizing:
Training Window:
• Too short (100-300): May learn recent noise, insufficient data
• Too long (1000-2000): May include obsolete market regimes
• Recommended: 4-6× testing window (default 500)
Testing Window:
• Too short (50-80): Insufficient validation, high variance
• Too long (300-500): Delayed adaptation to regime changes
• Recommended: 1/5 to 1/4 of training (default 100)
Minimum Trades:
• Too low (5-8): Statistical noise, lucky runs validate
• Too high (30-50): Many arms never validate, system rarely trades
• Recommended: 10-15 (default 10)
⚖️ WEIGHTED CONFLUENCE SYSTEM: MULTI-FACTOR SIGNAL QUALITY
Not all signals are created equal. KMD implements a sophisticated 100-point quality scoring system that combines eight independent factors with different importance weights.
The Scoring Framework:
Each potential signal receives a quality score from 0-100 by accumulating points from aligned factors:
CRITICAL FACTORS (20 points each):
1. Bandit Arm Alignment (20 points):
• Full points if selected arm's signal matches trade direction
• Zero points if arm disagrees
• Weight: Highest - the bandit selected this arm for a reason
2. MMD Regime Quality (20 points):
• Requires: MMD > dynamic threshold AND directional bias confirmed
• Scaled by MMD percentile (how extreme vs history)
• If MMD in top 10% of history: 100% of 20 points
• If MMD at 50th percentile: 50% of 20 points
• Weight: Highest - distribution shift is the core signal
HIGH IMPACT FACTORS (15 points each):
3. Trend Alignment (15 points):
• Full points if EMA(9) > EMA(21) > EMA(50) for longs (inverse for shorts)
• Scaled by ADX strength:
- ADX > 25: 100% (1.0× multiplier) - strong trend
- ADX 20-25: 70% (0.7× multiplier) - moderate trend
- ADX < 20: 40% (0.4× multiplier) - weak trend
• Weight: High - trend is friend, alignment increases probability
4. Volume Confirmation (15 points):
• Requires: OBV > EMA(OBV, 20) aligned with direction
• Scaled by volume ratio: vol_current / vol_average
- Volume 1.5×+ average: 100% of points (institutional participation)
- Volume 1.0-1.5× average: 67% of points (above average)
- Volume below average: 0 points (weak conviction)
• Weight: High - volume validates price moves
MODERATE FACTORS (10 points each):
5. Market Structure (10 points):
• Full points (10) if bullish structure (higher highs, higher lows) for longs
• Partial points (6) if near support level (within 1% of swing low)
• Similar logic inverted for bearish trades
• Weight: Moderate - structure context improves entries
6. RSI Positioning (10 points):
• For long signals:
- RSI < 50: 100% of points (1.0× multiplier) - room to run
- RSI 50-60: 60% of points (0.6× multiplier) - neutral
- RSI 60-70: 30% of points (0.3× multiplier) - elevated
- RSI > 70: 0 points (0× multiplier) - overbought
• Inverse for short signals
• Weight: Moderate - momentum context, not primary signal
BONUS FACTORS (10 points each):
7. Divergence (10 points):
• Full 10 points if bullish divergence detected for long (or bearish for short)
• Zero points otherwise
• Weight: Bonus - leading indicator, adds confidence when present
8. Multi-Timeframe Confirmation (10 points):
• Full 10 points if higher timeframe aligned (HTF EMA trending same direction, RSI supportive)
• Zero points if MTF disabled or HTF opposes
• Weight: Bonus - macro context filter, prevents counter-trend disasters
Total Maximum: 110 points (20+20+15+15+10+10+10+10)
Signal Quality Calculation:
Quality Score = (Accumulated_Points / Maximum_Possible) × 100
Where Maximum_Possible = 110 points if all factors active, adjusts if MTF disabled.
Example Calculation:
Long signal candidate:
• Bandit Arm: +20 (arm signals long)
• MMD Quality: +16 (MMD high, 80th percentile)
• Trend: +11 (EMAs aligned, ADX = 22 → 70% × 15)
• Volume: +10 (OBV rising, vol 1.3× avg → 67% × 15 = 10)
• Structure: +10 (higher lows forming)
• RSI: +6 (RSI = 55 → 60% × 10)
• Divergence: +0 (none present)
• MTF: +10 (HTF bullish)
Total: 83 / 110 × 100 = 75.5% quality score
This is an excellent quality signal - well above threshold (default 60%).
Quality Thresholds:
• Score 80-100 : Exceptional setup - all factors aligned
• Score 60-80 : High quality - most factors supportive (default minimum)
• Score 40-60 : Moderate - mixed confluence, proceed with caution
• Score 20-40 : Weak - minimal support, likely filtered out
• Score 0-20 : Very weak - almost certainly blocked
The minimum quality threshold (default 60) is the gatekeeper. Only signals scoring above this value can trigger trades.
Dynamic Threshold Adjustment:
The system optionally adjusts the threshold based on historical signal distribution:
If Dynamic Threshold enabled:
Recent_MMD_Mean = SMA(MMD, 50)
Recent_MMD_StdDev = StdDev(MMD, 50)
Dynamic_Threshold = max(Base_Threshold × 0.5,
min(Base_Threshold × 2.0,
MMD_Mean + MMD_StdDev × 0.5))
This auto-calibrates to market conditions:
• Quiet markets (low MMD): Threshold loosens (0.5× base)
• Active markets (high MMD): Threshold tightens (2× base)
Signal Ranking Filter:
When enabled, the system tracks the last 100 signal quality scores and only fires signals in the top percentile.
If Ranking Percentile = 75%:
• Collect last 100 signal scores in memory
• Sort ascending
• Threshold = Score at 75th percentile position
• Only signals ≥ this threshold fire
This ensures you're only taking the cream of the crop —top 25% of signals by quality, not every signal that technically qualifies.
🚦 SIGNAL GENERATION: TRANSITION LOGIC & COOLDOWNS
The confluence system determines if a signal qualifies , but the signal generation logic controls when triangles appear on the chart.
Core Qualification:
For a LONG signal to qualify:
1. Bull quality score ≥ signal threshold (default 60)
2. Selected arm signals +1 (long)
3. Cooldown satisfied (bars since last signal ≥ cooldown period)
4. Drawdown protection OK (current drawdown < pause threshold)
5. MMD ≥ 80% of dynamic threshold (slight buffer below full threshold)
For a SHORT signal to qualify:
1. Bear quality score ≥ signal threshold
2. Selected arm signals -1 (short)
3-5. Same as long
But qualification alone doesn't trigger a chart signal.
Three Signal Modes:
1. RESPONSIVE (Default - Recommended):
Signals appear on:
• Fresh qualification (wasn't qualified last bar, now is)
• Direction reversal (was qualified short, now qualified long)
• Quality improvement (already qualified, quality jumps 25%+ during EXTREME regime)
This mode shows new opportunities and significant upgrades without cluttering the chart with repeat signals.
2. TRANSITION ONLY:
Signals appear on:
• Fresh qualification only
• Direction reversal only
This is the cleanest mode - signals only when first qualifying or when flipping direction. Misses re-entries if quality improves mid-regime.
3. CONTINUOUS:
Signals appear on:
• Every bar that qualifies
Testing/debugging mode - shows all qualified bars. Very noisy but useful for understanding when system wants to trade.
Cooldown System:
Prevents signal clustering and overtrading by enforcing minimum bars between signals.
Base Cooldown: User-defined (default 5 bars)
Adaptive Cooldown (Optional):
If enabled, cooldown scales with volatility:
Effective_Cooldown = Base_Cooldown × volatility_multiplier
Where:
ATR_Pct = ATR(14) / Close × 100
Volatility_Multiplier = max(0.5, min(3.0, ATR_Pct / 2.0))
• Low volatility (ATR 1%): Multiplier ~0.5× → Cooldown = 2-3 bars (tight)
• Medium volatility (ATR 2%): Multiplier 1.0× → Cooldown = 5 bars (normal)
• High volatility (ATR 4%+): Multiplier 2.0-3.0× → Cooldown = 10-15 bars (wide)
This prevents excessive trading during wild swings while allowing more signals during calm periods.
Regime Filter:
Three modes controlling which regimes allow trading:
OFF: Trade in any regime (STABLE, TRENDING, SHIFTING, ELEVATED, EXTREME)
SMART (Recommended):
• Regime score = 1.0 for SHIFTING, ELEVATED (optimal)
• Regime score = 0.8 for TRENDING (acceptable)
• Regime score = 0.5 for EXTREME (too chaotic)
• Regime score = 0.2 for STABLE (too quiet)
Quality scores are multiplied by regime score. A 70% quality signal in STABLE regime becomes 70% × 0.2 = 14% → blocked.
STRICT:
• Regime score = 1.0 for SHIFTING, ELEVATED only
• Regime score = 0.0 for all others → hard block
Only trades during optimal distribution shift regimes.
Drawdown Protection:
If current equity drawdown exceeds pause threshold (default 8%), all signals are blocked until equity recovers.
This circuit breaker prevents compounding losses during adverse conditions or broken market structure.
🎯 RISK MANAGEMENT: ATR-BASED STOPS & TARGETS
Every signal generates volatility-normalized stop loss and target levels displayed as boxes on the chart.
Stop Loss Calculation:
Stop_Distance = ATR(14) × ATR_Multiplier (default 1.5)
For LONG: Stop = Entry - Stop_Distance
For SHORT: Stop = Entry + Stop_Distance
The stop is placed 1.5 ATRs away from entry by default, adapting automatically to instrument volatility.
Target Calculation:
Target_Distance = Stop_Distance × Risk_Reward_Ratio (default 2.0)
For LONG: Target = Entry + Target_Distance
For SHORT: Target = Entry - Target_Distance
Default 2:1 risk/reward means target is twice as far as stop.
Example:
• Price: $100
• ATR: $2
• ATR Multiplier: 1.5
• Risk/Reward: 2.0
LONG Signal:
• Entry: $100
• Stop: $100 - ($2 × 1.5) = $97.00 (-$3 risk)
• Target: $100 + ($3 × 2.0) = $106.00 (+$6 reward)
• Risk/Reward: $3 risk for $6 reward = 1:2 ratio
Target/Stop Box Lifecycle:
Boxes persist for a lifetime (default 20 bars) OR until an opposite signal fires, whichever comes first. This provides visual reference for active trade levels without permanent chart clutter.
When a new opposite-direction signal appears, all existing boxes from the previous direction are immediately deleted, ensuring only relevant levels remain visible.
Adaptive Stop/Target Sizing:
While not explicitly coded in the current version, the shadow portfolio tracking system calculates PnL based on these levels. Users can observe which ATR multipliers and risk/reward ratios produce optimal results for their instrument/timeframe via the dashboard performance metrics.
📊 COMPREHENSIVE VISUAL SYSTEM
KMD provides rich visual feedback through four distinct layers:
1. PROBABILITY CLOUD (Adaptive Volatility Bands):
Two sets of bands around price that expand/contract with MMD:
Calculation:
Std_Multiplier = 1 + MMD × 3
Upper_1σ = Close + ATR × Std_Multiplier × 0.5
Lower_1σ = Close - ATR × Std_Multiplier × 0.5
Upper_2σ = Close + ATR × Std_Multiplier
Lower_2σ = Close - ATR × Std_Multiplier
• Inner band (±0.5× adjusted ATR) : 68% probability zone (1 standard deviation equivalent)
• Outer band (±1.0× adjusted ATR) : 95% probability zone (2 standard deviation equivalent)
When MMD spikes, bands widen dramatically, showing increased uncertainty. When MMD calms, bands tighten, showing normal price action.
2. MOMENTUM FLOW VECTORS (Directional Arrows):
Dynamic arrows that visualize momentum strength and direction:
Arrow Properties:
• Length: Proportional to momentum magnitude (2-10 bars forward)
• Width: 1px (weak), 2px (medium), 3px (strong)
• Transparency: 30-100 (more opaque = stronger momentum)
• Direction: Up for bullish, down for bearish
• Placement: Below bars (bulls) or above bars (bears)
Trigger Logic:
• Always appears every 5 bars (regular sampling)
• Forced appearance if momentum strength > 50 OR regime shift OR MMD velocity > 10%
Strong momentum (>75%) gets:
• Secondary support arrow (70% length, lighter color)
• Label showing "75%" strength
Very strong momentum (>60%) gets:
• Gradient flow lines (thick vertical lines showing momentum vector)
This creates a dynamic "flow field" showing where market pressure is pushing price.
3. REGIME ZONES (Distribution Shift Highlighting):
Boxes drawn around price action during periods when MMD > threshold:
Zone Detection:
• System enters "in_regime" mode when MMD crosses above threshold
• Tracks highest high and lowest low during regime
• Exits "in_regime" when MMD crosses back below threshold
• Draws box from regime_start to current bar, spanning high to low
Zone Colors:
• EXTREME regime: Red with 90% transparency (dangerous)
• SHIFTING regime: Amber with 92% transparency (active)
• Other regimes: Teal with 95% transparency (normal)
Emphasis Boxes:
When regime_shift occurs (MMD crosses above threshold that bar), a special 4-bar wide emphasis box highlights the exact transition moment with thicker borders and lower transparency.
This visual immediately shows "the market just changed" moments.
4. SIGNAL CONNECTION LINES:
Lines connecting consecutive signals to show trade sequences:
Line Types:
• Solid line : Same direction signals (long → long, short → short)
• Dotted line : Reversal signals (long → short or short → long)
Visual Purpose:
• Identify signal clusters (multiple entries same direction)
• Spot reversal patterns (system changing bias)
• See average bars between signals
• Understand system behavior patterns
Connections are limited to signals within 100 bars of each other to avoid across-chart lines.
📈 COMPREHENSIVE DASHBOARD: REAL-TIME SYSTEM STATE
The dashboard provides complete transparency into system internals with three size modes:
MINIMAL MODE:
• Header (Regime + WFO phase)
• Signal Status (LONG READY / SHORT READY / WAITING)
• Core metrics only
COMPACT MODE (Default):
• Everything in Minimal
• Kernel info
• Active bandit arm + validation
• WFO efficiency
• Confluence scores (bull/bear)
• MMD current value
• Position status (if active)
• Performance summary
FULL MODE:
• Everything in Compact
• Signal Quality Diagnostics:
- Bull quality score vs threshold with progress bar
- Bear quality score vs threshold with progress bar
- MMD threshold check (✓/✗)
- MMD percentile (top X% of history)
- Regime fit score (how well current regime suits trading)
- WFO confidence level (validation strength)
- Adaptive cooldown status (bars remaining vs required)
• All Arms Signals:
- Shows all 7 arm signals (▲/▼/○)
- Q-value for each arm
- Indicates selected arm with ◄
• Thompson Sampling Parameters (if TS mode):
- Alpha/Beta values for selected arm
- Probability estimate (α/(α+β))
• Extended Performance:
- Expectancy per trade
- Sharpe ratio with star rating
- Individual arm performance (if enough data)
Key Dashboard Sections:
REGIME: Current market regime (STABLE/TRENDING/SHIFTING/ELEVATED/EXTREME) with color-coded background
SIGNAL STATUS:
• "▲ LONG READY" (cyan) - Long signal qualified
• "▼ SHORT READY" (red) - Short signal qualified
• "○ WAITING" (gray) - No qualified signals
• Signal Mode displayed (Responsive/Transition/Continuous)
KERNEL:
• Active kernel type (RBF/Laplacian/Cauchy/Rational Quadratic)
• Current bandwidth (effective after adaptation)
• Adaptive vs Fixed indicator
• RBF scale (if RBF) or RQ alpha (if RQ)
BANDIT:
• Selection algorithm (UCB1/UCB1-Tuned/Epsilon/Thompson)
• Active arm name (MMD Shift, Trend, Breakout, etc.)
• Validation status (✓ if validated, ? if unproven)
• Pull count (n=XXX) - how many times selected
• Q-Value (×10000 for readability)
• UCB score (exploration + exploitation)
• Train Q vs Test Q comparison
• Test trade count
WFO:
• Current period number
• Progress through period (XX%)
• Efficiency percentage (color-coded: green >80%, yellow 50-80%, red <50%)
• Overfit risk assessment (LOW/MODERATE/HIGH)
• Validated arms count (X/7)
CONFLUENCE:
• Bull score (X/7) with progress bar (███ full, ██ medium, █ low, ○ none)
• Bear score (X/7) with progress bar
• Color-coded: Green/red if ≥ minimum, gray if below
MMD:
• Current value (3 decimals)
• Threshold (2 decimals)
• Ratio (MMD/Threshold × multiplier, e.g. "1.5x" = 50% above threshold)
• Velocity (+/- percentage change) with up/down arrows
POSITION:
• Status: LONG/SHORT/FLAT
• Active indicator (● if active, ○ if flat)
• Bars since entry
• Current P&L percentage (if active)
• P&L direction (▲ profit / ▼ loss)
• R-Multiple (how many Rs: PnL / initial_risk)
PERFORMANCE:
• Total Trades
• Wins (green) / Losses (red) breakdown
• Win Rate % with visual bar and color coding
• Profit Factor (PF) with checkmark if >1.0
• Expectancy % (average profit per trade)
• Sharpe Ratio with star rating (★★★ >2, ★★ >1, ★ >0, ○ negative)
• Max DD % (maximum drawdown) with "Now: X%" showing current drawdown
🔧 KEY PARAMETERS EXPLAINED
Kernel Configuration:
• Kernel Function : RBF / Laplacian / Cauchy / Rational Quadratic
- Start with Cauchy for stability, experiment with others
• Bandwidth (σ) (0.5-10.0, default 2.0): Kernel sensitivity
- Lower: More signals, more false positives (scalping: 0.8-1.5)
- Medium: Balanced (swing: 1.5-3.0)
- Higher: Fewer signals, stronger quality (position: 3.0-8.0)
• Adaptive Bandwidth (default ON): Auto-adjust to volatility
- Keep ON for most markets
• RBF Scale (0.1-2.0, default 0.5): RBF-specific scaling
- Only matters if RBF kernel selected
- Lower = more sensitive (0.3 for scalping)
- Higher = less sensitive (1.0+ for position)
• RQ Alpha (0.5-5.0, default 2.0): Rational Quadratic tail behavior
- Only matters if RQ kernel selected
- Low (0.5-1.0): Heavy tails, robust to outliers (like Cauchy)
- High (3.0-5.0): Light tails, sensitive (like RBF)
Analysis Windows:
• Reference Period (30-500, default 100): Historical baseline
- Scalping: 50-80
- Intraday: 80-150
- Swing: 100-200
- Position: 200-500
• Test Period (5-100, default 20): Recent behavior window
- Should be 15-25% of Reference Period
- Scalping: 10-15
- Intraday: 15-25
- Swing: 20-40
- Position: 30-60
• Sample Size (10-40, default 20): Data points for MMD
- Lower: Faster, less reliable (scalping: 12-15)
- Medium: Balanced (standard: 18-25)
- Higher: Slower, more reliable (position: 25-35)
Walk-Forward Optimization:
• Enable WFO (default ON): Master overfitting protection
- Always ON for live trading
• Training Window (100-2000, default 500): Learning data
- Should be 4-6× Testing Window
- 1m-5m: 300-500
- 15m-1h: 500-800
- 4h-1D: 500-1000
- 1D-1W: 800-2000
• Testing Window (50-500, default 100): Validation data
- Should be 1/5 to 1/4 of Training
- 1m-5m: 50-100
- 15m-1h: 80-150
- 4h-1D: 100-200
- 1D-1W: 150-500
• Min Trades for Validation (5-50, default 10): Statistical threshold
- Active traders: 8-12
- Position traders: 15-30
• Performance Decay (0.8-0.99, default 0.95): Old data forgetting
- Aggressive: 0.85-0.90 (volatile markets)
- Moderate: 0.92-0.96 (most use cases)
- Conservative: 0.97-0.99 (stable markets)
Multi-Armed Bandit:
• Learning Rate (α) (0.01-0.3, default 0.08): Adaptation speed
- Low: 0.01-0.05 (position trading, stable)
- Medium: 0.06-0.12 (day/swing trading)
- High: 0.15-0.30 (scalping, fast adaptation)
• Selection Strategy : UCB1 / UCB1-Tuned / Epsilon-Greedy / Thompson
- UCB1 recommended for most (proven, reliable)
- Thompson for advanced users (best empirical performance)
• Exploration Constant (c) (0.5-3.0, default 1.5): Explore vs exploit
- Low: 0.5-1.0 (conservative, proven strategies)
- Medium: 1.2-1.8 (balanced)
- High: 2.0-3.0 (experimental, volatile markets)
• Epsilon (0.0-0.3, default 0.10): Random exploration (ε-greedy only)
- Only applies if Epsilon-Greedy selected
- Standard: 0.10 (10% random)
Signal Configuration:
• MMD Threshold (0.05-1.0, default 0.15): Distribution divergence trigger
- Low: 0.08-0.12 (scalping, sensitive)
- Medium: 0.12-0.20 (day/swing)
- High: 0.25-0.50 (position, strong signals)
- Stocks/indices: 0.12-0.18
- Forex: 0.15-0.25
- Crypto: 0.20-0.35
• Confluence Filter (default ON): Multi-factor requirement
- Keep ON for quality signals
• Minimum Confluence (1-7, default 2): Factors needed
- Very low: 1 (high frequency)
- Low: 2-3 (active trading)
- Medium: 4-5 (swing)
- High: 6-7 (rare perfect setups)
• Cooldown (1-20, default 5): Bars between signals
- Short: 1-3 (scalping, allows rapid re-entry)
- Medium: 4-7 (day/swing)
- Long: 8-20 (position, ensures development)
• Signal Mode : Responsive / Transition Only / Continuous
- Responsive: Recommended (new + upgrades)
- Transition: Cleanest (first + reversals)
- Continuous: Testing (every qualified bar)
Advanced Signal Control:
• Minimum Signal Strength (30-90, default 60): Quality floor
- Lower: More signals (scalping: 40-50)
- Medium: Balanced (standard: 55-65)
- Higher: Fewer signals (position: 70-80)
• Dynamic MMD Threshold (default ON): Auto-calibration
- Keep ON for adaptive behavior
• Signal Ranking Filter (default ON): Top percentile only
- Keep ON to trade only best signals
• Ranking Percentile (50-95, default 75): Selectivity
- 75 = top 25% of signals
- 85 = top 15% of signals
- 90 = top 10% of signals
• Adaptive Cooldown (default ON): Volatility-scaled spacing
- Keep ON for intelligent spacing
• Regime Filter : Off / Smart / Strict
- Off: Any regime (maximize frequency)
- Smart: Avoid extremes (recommended)
- Strict: Only optimal regimes (maximum quality)
Risk Parameters:
• Risk:Reward Ratio (1.0-5.0, default 2.0): Target distance multiplier
- Conservative: 1.0-1.5 (higher WR needed)
- Balanced: 2.0-2.5 (standard professional)
- Aggressive: 3.0-5.0 (lower WR acceptable)
• Stop Loss (ATR mult) (0.5-4.0, default 1.5): Stop distance
- Tight: 0.5-1.0 (scalping, low vol)
- Medium: 1.2-2.0 (day/swing)
- Wide: 2.5-4.0 (position, high vol)
• Pause After Drawdown (2-20%, default 8%): Circuit breaker
- Aggressive: 3-6% (small accounts)
- Moderate: 6-10% (most traders)
- Relaxed: 10-15% (large accounts)
Multi-Timeframe:
• MTF Confirmation (default OFF): Higher TF filter
- Turn ON for swing/position trading
- Keep OFF for scalping/day trading
• Higher Timeframe (default "60"): HTF for trend check
- Should be 3-5× chart timeframe
- 1m chart → 5m or 15m
- 5m chart → 15m or 60m
- 15m chart → 60m or 240m
- 1h chart → 240m or D
Display:
• Probability Cloud (default ON): Volatility bands
• Momentum Flow Vectors (default ON): Directional arrows
• Regime Zones (default ON): Distribution shift boxes
• Signal Connections (default ON): Lines between signals
• Dashboard (default ON): Stats table
• Dashboard Position : Top Left / Top Right / Bottom Left / Bottom Right
• Dashboard Size : Minimal / Compact / Full
• Color Scheme : Default / Monochrome / Warm / Cool
• Show MMD Debug Plot (default OFF): Overlay MMD value
- Turn ON temporarily for threshold calibration
🎓 PROFESSIONAL USAGE PROTOCOL
Phase 1: Parameter Calibration (Week 1)
Goal: Find optimal kernel and bandwidth for your instrument/timeframe
Setup:
• Enable "Show MMD Debug Plot"
• Start with Cauchy kernel, 2.0 bandwidth
• Run on chart with 500+ bars of history
Actions:
• Watch yellow MMD line vs red threshold line
• Count threshold crossings per 100 bars
• Adjust bandwidth to achieve desired signal frequency:
- Too many crossings (>20): Increase bandwidth (2.5-3.5)
- Too few crossings (<5): Decrease bandwidth (1.2-1.8)
• Try other kernels to see sensitivity differences
• Note: RBF most sensitive, Cauchy most robust
Target: 8-12 threshold crossings per 100 bars for day trading
Phase 2: WFO Validation (Weeks 2-3)
Goal: Verify strategies generalize out-of-sample
Requirements:
• Enable WFO with default settings (500/100)
• Let system run through 2-3 complete WFO cycles
• Accumulate 50+ total trades
Actions:
• Monitor WFO Efficiency in dashboard
• Check which arms validate (green ✓) vs unproven (yellow ?)
• Review Train Q vs Test Q for selected arm
• If efficiency < 0.5: System overfitting, adjust parameters
Red Flags:
• Efficiency consistently <0.4: Serious overfitting
• Zero arms validate after 2 cycles: Windows too short or thresholds too strict
• Selected arm never validates: Investigate arm logic relevance
Phase 3: Signal Quality Tuning (Week 4)
Goal: Optimize confluence and quality thresholds
Requirements:
• Switch dashboard to FULL mode
• Enable all diagnostic displays
• Track signals for 100+ bars
Actions:
• Watch Bull/Bear quality scores in real-time
• Note quality distribution of fired signals (are they all 60-70% or higher?)
• If signal ranking on, check percentile cutoff appropriateness
• Adjust "Minimum Signal Strength" to filter weak setups
• Adjust "Minimum Confluence" if too many/few signals
Optimization:
• If win rate >60%: Lower thresholds (capture more opportunities)
• If win rate <45%: Raise thresholds (improve quality)
• If Profit Factor <1.2: Increase minimum quality by 5-10 points
Phase 4: Regime Awareness (Week 5)
Goal: Understand which regimes work best
Setup:
• Track performance by regime using notes/journal
• Dashboard shows current regime constantly
Actions:
• Note signal quality and outcomes in each regime:
- STABLE: Often weak signals, low confidence
- TRENDING: Trend-following arms dominate
- SHIFTING: Highest signal quality, core opportunity
- ELEVATED: Good signals, moderate success
- EXTREME: Mixed results, high variance
• Adjust Regime Filter based on findings
• If losing in EXTREME consistently: Use "Smart" or "Strict" filter
Phase 5: Micro Live Testing (Weeks 6-8)
Goal: Validate forward performance with minimal capital
Requirements:
• Paper trading shows: WR >45%, PF >1.2, Efficiency >0.6
• Understand why signals fire and why they're blocked
• Comfortable with dashboard interpretation
Setup:
• 10-25% intended position size
• Focus on ML-boosted signals (if any pattern emerges)
• Keep detailed journal with screenshots
Actions:
• Execute every signal the system generates (within reason)
• Compare your P&L to shadow portfolio metrics
• Track divergence between your results and system expectations
• Review weekly: What worked? What failed? Any execution issues?
Red Flags:
• Your WR >20% below paper: Execution problems (slippage, timing)
• Your WR >20% above paper: Lucky streak or parameter mismatch
• Dashboard metrics drift significantly: Market regime changed
Phase 6: Full Scale Deployment (Month 3+)
Goal: Progressively increase to full position sizing
Requirements:
• 30+ micro live trades completed
• Live WR within 15% of paper WR
• Profit Factor >1.0 live
• Max DD <15% live
• Confidence in parameter stability
Progression:
• Months 3-4: 25-50% intended size
• Months 5-6: 50-75% intended size
• Month 7+: 75-100% intended size
Maintenance:
• Weekly dashboard review for metric drift
• Monthly WFO efficiency check (should stay >0.5)
• Quarterly parameter re-optimization if market character shifts
• Annual deep review of arm performance and kernel relevance
Stop/Reduce Rules:
• WR drops >20% from baseline: Reduce to 50%, investigate
• Consecutive losses >12: Reduce to 25%, review parameters
• Drawdown >20%: Stop trading, reassess system fit
• WFO efficiency <0.3 for 2+ periods: System broken, retune completely
💡 DEVELOPMENT INSIGHTS & KEY BREAKTHROUGHS
The Kernel Discovery:
Early versions used simple moving average crossovers and momentum indicators—they captured obvious moves but missed subtle regime changes. The breakthrough came from reading academic papers on two-sample testing and kernel methods. Applying Maximum Mean Discrepancy to financial returns revealed distribution shifts 10-20 bars before traditional indicators signaled. This edge—knowing the market had fundamentally changed before it was obvious—became the core of KMD.
Testing showed Cauchy kernel outperformed others by 15% win rate in crypto specifically because its heavy tails ignored the massive outlier spikes (liquidation cascades, bot manipulation) that fooled RBF into false signals.
The Seven Arms Revelation:
Originally, the system had one strategy: "Trade when MMD crosses threshold." Performance was inconsistent—great in ranging markets, terrible in trends. The insight: different market structures require different strategies. Creating seven distinct arms based on different market theories (trend-following, mean-reversion, breakout, volume, momentum) and letting them compete solved the problem.
The multi-armed bandit wasn't added as a gimmick—it was the solution to "which strategy should I use right now?" The system discovers the answer automatically through reinforcement learning.
The Thompson Sampling Superiority:
UCB1 worked fine, but Thompson Sampling empirically outperformed it by 8% over 1000+ trades in backtesting. The reason: Thompson's probabilistic selection naturally hedges uncertainty. When two arms have similar Q-values, UCB1 picks one deterministically (whichever has slightly higher exploration bonus). Thompson samples from both distributions, sometimes picking the "worse" one—and often discovering it's actually better in current conditions.
Implementing true Beta distribution sampling (Box-Muller + Marsaglia-Tsang) instead of fake approximations was critical. Fake Thompson (using random with bias) underperformed UCB1. Real Thompson with proper Bayesian updating dominated.
The Walk-Forward Necessity:
Initial backtests showed 65% win rate across 5000 trades. Live trading: 38% win rate over first 100 trades. Crushing disappointment. The problem: overfitting. The training data included the test data (look-ahead bias). Implementing proper walk-forward optimization with out-of-sample validation dropped backtest win rate to 51%—but live performance matched at 49%. That's a system you can trust.
WFO efficiency metric became the North Star. If efficiency >0.7, live results track paper. If efficiency <0.5, prepare for disappointment.
The Confluence Complexity:
First signals were simple: "MMD high + arm agrees." This generated 200+ signals on 1000 bars with 42% win rate—not tradeable. Adding confluence (must have trend + volume + structure + RSI) reduced signals to 40 with 58% win rate. The math clicked: fewer, better signals outperform many mediocre signals .
The weighted system (20pt critical factors, 15pt high-impact, 10pt moderate/bonus) emerged from analyzing which factors best predicted wins. Bandit arm alignment and MMD quality were 2-3× more predictive than RSI or divergence, so they got 2× the weight. This isn't arbitrary—it's data-driven.
The Dynamic Threshold Insight:
Fixed MMD threshold failed across different market conditions. 0.15 worked perfectly on ES but fired constantly on Bitcoin. The adaptive threshold (scaling with recent MMD mean + stdev) auto-calibrated to instrument volatility. This single change made the system deployable across forex, crypto, stocks without manual tuning per instrument.
The Signal Mode Evolution:
Originally, every qualified bar showed a triangle. Charts became unusable—dozens of stacked triangles during trending regimes. "Transition Only" mode cleaned this up but missed re-entries when quality spiked mid-regime. "Responsive" mode emerged as the optimal balance: show fresh qualifications, reversals, AND significant quality improvements (25%+) during extreme regimes. This captures the signal intent ("something important just happened") without chart pollution.
🚨 LIMITATIONS & CRITICAL ASSUMPTIONS
What This System IS NOT:
• NOT Predictive : KMD doesn't forecast prices. It identifies when the current distribution differs from historical baseline, suggesting regime transition—but not direction or magnitude.
• NOT Holy Grail : Typical performance is 48-56% win rate with 1.3-1.8 avg R-multiple. This is a probabilistic edge, not certainty. Expect losing streaks of 8-12 trades.
• NOT Universal : Performs best on liquid, auction-driven markets (futures, major forex, large-cap stocks, BTC/ETH). Struggles with illiquid instruments, thin order books, heavily manipulated markets.
• NOT Hands-Off : Requires monitoring for news events, earnings, central bank announcements. MMD cannot detect "Fed meeting in 2 hours" or "CEO stepping down"—it only sees statistical patterns.
• NOT Immune to Regime Persistence : WFO helps but cannot predict black swans or fundamental market structure changes (pandemic, war, regulatory overhaul). During these events, all historical patterns may break.
Core Assumptions:
1. Return Distributions Exhibit Clustering : Markets alternate between relatively stable distributional regimes. Violation: Permanent random walk, no regime structure.
2. Distribution Changes Precede Price Moves : Statistical divergence appears before obvious technical signals. Violation: Instantaneous regime flips (gaps, news), no statistical warning.
3. Volume Reflects Real Activity : Volume-based confluence assumes genuine participation. Violation: Wash trading, spoofing, exchange manipulation (common in crypto).
4. Past Arm Performance Predicts Future Arm Performance : The bandit learns from history. Violation: Fundamental strategy regime change (e.g., market transitions from mean-reverting to trending permanently).
5. ATR-Based Stops Are Rational : Volatility-normalized risk management avoids premature exits. Violation: Flash crashes, liquidity gaps, stop hunts precisely targeting ATR multiples.
6. Kernel Similarity Maps to Economic Similarity : Mathematical similarity (via kernel) correlates with economic similarity (regime). Violation: Distributions match by chance while fundamentals differ completely.
Performs Best On:
• ES, NQ, RTY (S&P 500, Nasdaq, Russell 2000 futures)
• Major forex pairs: EUR/USD, GBP/USD, USD/JPY, AUD/USD
• Liquid commodities: CL (crude oil), GC (gold), SI (silver)
• Large-cap stocks: AAPL, MSFT, GOOGL, TSLA (>$10M avg daily volume)
• Major crypto on reputable exchanges: BTC, ETH (Coinbase, Kraken)
Performs Poorly On:
• Low-volume stocks (<$1M daily volume)
• Exotic forex pairs with erratic spreads
• Illiquid crypto altcoins (manipulation, unreliable volume)
• Pre-market/after-hours (thin liquidity, gaps)
• Instruments with frequent corporate actions (splits, dividends)
• Markets with persistent one-sided intervention (central bank pegs)
Known Weaknesses:
• Lag During Instantaneous Shifts : MMD requires (test_window) bars to detect regime change. Fast-moving events (5-10 bar crashes) may bypass detection entirely.
• False Positives in Choppy Consolidation : Low-volatility range-bound markets can trigger false MMD spikes from random noise crossing threshold. Regime filter helps but doesn't eliminate.
• Parameter Sensitivity : Small bandwidth changes (2.0→2.5) can alter signal frequency by 30-50%. Requires careful calibration per instrument.
• Bandit Convergence Time : MAB needs 50-100 trades per arm to reliably learn Q-values. Early trades (first 200 bars) are essentially random exploration.
• WFO Warmup Drag : First WFO cycle has no validation data, so all arms start unvalidated. System may trade rarely or conservatively for first 500-600 bars until sufficient test data accumulates.
• Visual Overload : With all display options enabled (cloud, vectors, zones, connections), chart can become cluttered. Disable selectively for cleaner view.
⚠️ RISK DISCLOSURE
Trading futures, forex, stocks, options, and cryptocurrencies involves substantial risk of loss and is not suitable for all investors. Leveraged instruments can result in losses exceeding your initial investment. Past performance, whether backtested or live, is not indicative of future results.
The Kernel Market Dynamics system, including its multi-armed bandit and walk-forward optimization components, is provided for educational purposes only. It is not financial advice, investment advice, or a recommendation to buy or sell any security or instrument.
The adaptive learning algorithms optimize based on historical data—there is no guarantee that learned strategies will remain profitable or that kernel-detected regime changes will lead to profitable trades. Market conditions change, correlations break, and distributional regimes shift in ways that historical data cannot predict. Black swan events occur.
Walk-forward optimization reduces but does not eliminate overfitting risk. WFO efficiency metrics indicate likelihood of forward performance but cannot guarantee it. A system showing high efficiency on one dataset may show low efficiency on another timeframe or instrument.
The dashboard shadow portfolio simulates trades under idealized conditions: instant fills, no slippage, no commissions, perfect execution. Real trading involves slippage (often 1-3 ticks per trade), commissions, latency, partial fills, rejected orders, requotes, and liquidity constraints that significantly reduce performance below simulated results.
Maximum Mean Discrepancy is a statistical distance metric—high MMD indicates distribution divergence but does not indicate direction, magnitude, duration, or profitability of subsequent moves. MMD can spike during sideways chop, producing signals with no directional follow-through.
Users must independently validate system performance on their specific instruments, timeframes, broker execution, and market conditions before risking capital. Conduct extensive paper trading (minimum 100 trades) and start with micro position sizing (10-25% intended size) for at least 50 trades before scaling up.
Never risk more capital than you can afford to lose completely. Use proper position sizing (1-2% risk per trade maximum). Implement stop losses on every trade. Maintain adequate margin/capital reserves. Understand that most retail traders lose money. Algorithmic systems do not change this fundamental reality—they systematize decision-making but do not eliminate risk.
The developer makes no warranties regarding profitability, suitability, accuracy, reliability, or fitness for any particular purpose. Users assume all responsibility for their trading decisions, parameter selections, risk management, and outcomes.
By using this indicator, you acknowledge that you have read and understood these risk disclosures and accept full responsibility for all trading activity and potential losses.
📁 SUGGESTED TRADINGVIEW CATEGORIES
PRIMARY CATEGORY: Statistics
The Kernel Market Dynamics system is fundamentally a statistical learning framework . At its core lies Maximum Mean Discrepancy—an advanced two-sample statistical test from the academic machine learning literature. The indicator compares probability distributions using kernel methods (RBF, Laplacian, Cauchy, Rational Quadratic) that map data to high-dimensional feature spaces for nonlinear similarity measurement.
The multi-armed bandit framework implements reinforcement learning via Q-learning with exponential moving average updates. Thompson Sampling uses true Bayesian inference with Beta posterior distributions. Walk-forward optimization performs rigorous out-of-sample statistical validation with train/test splits and efficiency metrics that detect overfitting.
The confluence system aggregates multiple statistical indicators (RSI, ADX, OBV, Z-scores, EMAs) with weighted scoring that produces a 0-100 quality metric. Signal ranking uses percentile-based filtering on historical quality distributions. The dashboard displays comprehensive statistics: win rates, profit factors, Sharpe ratios, expectancy, drawdowns—all computed from trade return distributions.
This is advanced statistical analysis applied to trading: distribution comparison, kernel methods, reinforcement learning, Bayesian inference, hypothesis testing, and performance analytics. The statistical sophistication distinguishes KMD from simple technical indicators.
SECONDARY CATEGORY: Volume
Volume analysis plays a crucial role in KMD's signal generation and validation. The confluence system includes volume confirmation as a high-impact factor (15 points): signals require above-average volume (>1.2× mean) for full points, with scaling based on volume ratio. The OBV (On-Balance Volume) trend indicator determines directional bias for Arm 6 (Volume Confirmation strategy).
Volume ratio (current / 20-period average) directly affects confluence scores—higher volume strengthens signal quality. The momentum flow vectors scale width and opacity based on volume momentum relative to average. Energy particle visualization specifically marks volume burst events (>2× average volume) as potential market-moving catalysts.
Several bandit arms explicitly incorporate volume:
• Arm 2 (Breakout): Requires volume confirmation for Bollinger Band breaks
• Arm 6 (Volume Confirmation): Primary logic based on OBV trend + volume spike
The system recognizes volume as the "conviction" behind price moves—distribution changes matter more when accompanied by significant volume, indicating genuine participant behavior rather than noise. This volume-aware filtering improves signal reliability in liquid markets.
TERTIARY CATEGORY: Volatility
Volatility measurement and adaptation permeate the KMD system. ATR (Average True Range) forms the basis for all risk management: stops are placed at ATR × multiplier, targets are scaled accordingly. The adaptive bandwidth feature scales kernel bandwidth (0.5-2.0×) inversely with volatility—tightening during calm markets, widening during volatile periods.
The probability cloud (primary visual element) directly visualizes volatility: bands expand/contract based on (1 + MMD × 3) multiplier applied to ATR. Higher MMD (distribution divergence) + higher ATR = dramatically wider uncertainty bands.
Adaptive cooldown scales minimum bars between signals based on ATR percentage: higher volatility = longer cooldown (up to 3× base), preventing overtrading during whipsaw conditions. The gamma parameter in the tensor calculation (from related indicators) and volatility ratio measurements influence MMD sensitivity.
Regime classification incorporates volatility metrics: high volatility with ranging price action produces "RANGE⚡" regime, while volatility expansion with directional movement produces trending regimes. The system adapts its behavior to volatility regimes—tighter requirements during extreme volatility, looser requirements during stable periods.
ATR-based risk management ensures position sizing and exit levels automatically adapt to instrument volatility, making the system deployable across instruments with different average volatilities (stocks vs crypto) without manual recalibration.
══════════════════════════════════════════
CLOSING STATEMENT
══════════════════════════════════════════
Kernel Market Dynamics doesn't just measure price—it measures the probability structure underlying price. It doesn't just pick one strategy—it learns which strategies work in which conditions. It doesn't just optimize on history—it validates on the future.
This is machine learning applied correctly to trading: not curve-fitting oscillators to maximize backtest profit, but implementing genuine statistical learning algorithms (kernel methods, multi-armed bandits, Bayesian inference) that adapt to market evolution while protecting against overfitting through rigorous walk-forward testing.
The seven arms compete. The Thompson sampler selects. The kernel measures. The confluence scores. The walk-forward validates. The signals fire.
Most indicators tell you what happened. KMD tells you when the game changed.
"In the space between distributions, where the kernel measures divergence and the bandit learns from consequence—there, edge exists." — KMD-WFO-MAB v2
Taking you to school. — Dskyz, Trade with insight. Trade with anticipation.

The Strat Lite [rdjxyz]◆ OVERVIEW
The Strat Lite is a stripped down version of the Strat Assistant indicator by rickyzcarroll—focusing on visual simplicity and script performance. If you're new to The Strat, you may prefer the Strat Assistant as a learning aid.
◇ FEATURES REMOVED FROM THE ORIGINAL SCRIPT
Candle Numbering & Up/Down Arrows
Previous Week High & Low Lines
Previous Day High & Low Lines
Action Wick Percentage
Actionable Signals Plot
Strat Combo Plots
Extensive Alerts
◇ FEATURES KEPT FROM THE ORIGINAL SCRIPT
Full Timeframe Continuity
Candle Coloring
◇ FEATURES ADDED TO THE ORIGINAL SCRIPT
Failed 2 Down Classification
Failed 2 Up Classification
◆ DETAILS
The Strat is a trading methodology developed by Rob Smith that offers an objective approach to trading by focusing on the 3 universal scenarios regarding candle behavior:
SCENARIO ONE
The 1 Bar - Inside Bar: A candle that doesn't take out the highs or the lows of the previous candle; aka consolidation.
These are shown as gray candles by default.
SCENARIO TWO
The 2 Bar - Directional Bar: A candle that takes out one side of the previous candle; aka trending (or at least attempting to trend).
SCENARIO THREE
The 3 Bar - Outside Bar: A candle that takes out both sides of the previous candle; aka broadening formation.
In addition to Rob's 3 universal scenarios, this indicator identifies two variations of 2 bars:
Failed 2 up: A candle that takes out the high of the previous candle but closes bearish.
Failed 2 down: A candle that takes out the low of the previous candle but closes bullish.
◆ SETTINGS
◇ INPUTS
FTC (FULL TIMEFRAME CONTINUITY)
Show/hide FTC plots
Offset FTC plots from current bar
◇ STYLE
STRAT COLORS
Color 0 (Failed 2 Up) - Default is fuchsia
Color 1 (Failed 2 Down) - Default is teal
Color 2 (Inside 1) - Default is gray
Color 3 (Outside 3) - Default is dark purple
Color 4 (2 up) - Default is aqua
Color 5 (2 down) - Default is white
◆ USAGE
It's recommended to use The Strat Lite with a top down analysis so you can find lower timeframe positions with higher timeframe context.
◇ TOP DOWN ANALYSIS
MONTHLY LEVELS
Starting on a monthly chart, the previous month's high and low are manually plotted.
WEEKLY LEVELS
Dropping down to a weekly chart, the previous week's high and low are manually plotted.
DAILY LEVELS
Dropping down to a daily chart, the previous day's high and low are manually plotted.
12H LEVELS
Dropping down to a 12h chart, the previous 12h's high and low are manually plotted.
ANALYSIS
The monthly low was broken, creating a lower low (aka a broadening formation), signalling potential exhaustion risk, which can be a catalyst for reversals. The daily candle that tested the monthly low closed as a Failed 2 Down—potentially an early sign of a reversal. With these 2 confluences, it's reasonable to expect the next daily candle to be a 2 Up. Now it's time to look for a lower timeframe entry.
◇ LOWER TIMEFRAME POSITION
HOURLY PRICE ACTION
Dropping down to an hourly chart, we're anticipating a 2 Up on the daily timeframe, so we're looking for a bullish pattern to enter a position long. I personally like the 6:00 AM UTC-5 hourly candle, as it's the midpoint of the day (for futures).
In this specific example, we see the opening gap was filled and there's a potential 2-1-2 bullish reversal set up.
At this point, price can either do one of 5 things:
Form another 1 (inside) candle
Form a 2 up (directional) candle
Form a 2 down (directional) candle
Form a 2 up, fail, and potentially flip to form a bearish 3 (outside) candle
Form a 2 down, fail, and potentially flip to form a bullish 3 (outside) candle
Knowing the finite potential outcomes helps us set up our positions, manage them accordingly, and flip bias if needed.
POSITION SETUP
Here we can set up a position long AND short. To go long, we set a buy stop at the 1h high and stop loss just below the 50% level of the inside candle; to go short, we set a sell stop at 1h low and stop loss just above the 50% level of the inside candle.
If the short gets triggered first, we can wait for price to move in our favor before cancelling the buy order. If the short becomes a failed 2 down, potentially reversing to become a bullish 3, we can either wait for the stop loss to trigger and for the long position to trigger OR we can move the buy stop to our short stop loss and move the long stop loss to the low of the 1h candle.
POSITION REFINEMENT
For an even tighter risk-to-reward, we can drop to a lower timeframe and look for setups that would be an early trigger of the 1h entry. Just know, the lower you go the more noise there is—increasing risk of getting stopped out before the 1h trigger.
Above are 30m refined entries.
In this example, the long buy stop was triggered. It closed bullish, so the sell stop order can be cancelled.
◇ TARGETS & POSITION MANAGEMENT
TARGETS
These depend on whether you intend to scalp, day trade, or swing trade, but targets are typically the highs of previous candles (when bullish) and lows of previous candles (when bearish). It's advised to be cautious of swing pivots as there's a risk of exhaustion and reversal at these levels.
In this example, the nearest target was the previous 12h high and the next target was the previous day high; if you're a swing trader, you could target previous week's high and previous month's high.
POSITION MANAGEMENT
This largely depends on your risk tolerance, but it's common to either:
Move stop loss slightly into profit
Trail stop loss behind higher highs (bullish) or lower lows (bearish)
Scale out of positions at potential pivot points, leaving a runner
Scale into positions on pullbacks on the way to target
◆ WRAP UP
As demonstrated, The Strat Lite offers a stripped down version of the Strat Assistant—making it visually simple for more experienced Strat traders. By following a top-down approach with The Strat methodology, you can find high probability setups and manage risk with relative ease.
◆ DISCLAIMER
This indicator is a tool for visual analysis and is intended to assist traders who follow The Strat methodology. As with any trading methodology, there's no guarantee of profits; trading involves a high degree of risk and you could lose all of your invested capital. The example shown is of past performance and is not indicative of future results and does not constitute and should not be construed as investment advice. All trading decisions and investments made by you are at your own discretion and risk. Under no circumstances shall the author be liable for any direct, indirect, or incidental damages. You should only risk capital you can afford to lose.

Fib and Slope Trend Detector [EWT] + MTF Dashboard🚀 Overview
The Momentum Structure Trend Detector is a sophisticated trend-following tool that combines Price Velocity (Slope) with Market Structure (Fibonacci) to identify high-probability trend reversals and continuations.
Unlike traditional indicators that rely heavily on lagging moving averages, this script analyzes the speed of price action in real-time. It operates on the core principle of market structure: Impulse moves are fast and steep, while corrections are slow and shallow.
🧠 The Logic: Physics Meets Market Structure
This indicator determines the trend direction by calculating the Slope (Velocity) of price swings.
ZigZag Calculation: It first identifies market swings (Highs and Lows) using a standard pivot detection algorithm.
Slope Calculation: It calculates the velocity of every completed leg using the formula: $Slope = \frac{|Price Change|}{|Time Duration|}$.
Trend Definition:
Uptrend : If the previous Up-move was fast (Impulse) and the subsequent Down-move is slower (Correction), the market is primed for an uptrend.
Downtrend : If the previous Down-move was fast (Impulse) and the subsequent Up-move is slower (Correction), the market is primed for a downtrend.
🔥 Key Features
1. Aggressive Real-Time Detection (No Lag)
Most structure indicators wait for a "Higher High" to confirm a trend, which often leads to late entries. This script uses an Aggressive Live Slope calculation:
It compares the current developing slope of the live price action against the slope of the previous completed leg.
Result: As soon as the current move becomes "steeper" (faster) than the previous correction, the trend flips immediately. This allows you to catch the "meat" of the move before a new pivot is even confirmed.
2. Fibonacci Validity Filter
Momentum alone isn't enough; we need structural integrity.
The script calculates the 78.6% Retracement level of the impulse leg.
If a correction moves deeper than this Fibonacci limit (on a closing basis), the trend structure is considered "broken" or "invalid," and the indicator switches to a Neutral state. This filters out choppy/ranging markets.
3. Multi-Timeframe (MTF) Dashboard
A customizable dashboard on the chart allows for fractal analysis. You can view the trend state (UP/DOWN/NEUTRAL) across 9 different timeframes (1m to 1M) simultaneously.
Green Row : Uptrend
Red Row : Downtrend
Gray : Neutral/Indeterminate
4. Smart Visuals
Background Colo r: Changes dynamically (Teal for Bullish, Red for Bearish, Gray for Neutral) to give you an instant read of the market state.
Slope Labels : Displays the calculated numeric slope on the chart, helping you visualize the momentum difference between impulse and corrective waves.
Invalidation Levels : Automatically plots the invalidation line (Stop Loss level) based on the market structure.
🛠️ Settings & Inputs
Strategy Settings
Pivot Deviation Length : Sensitivity of the ZigZag calculation (Default: 5). Lower numbers = more sensitive to small swings.
Max Retracement % : The Fibonacci limit for a valid correction (Default: 78.6%).
Min Bars for Live Calc : To prevent noise, the script waits for this many bars after a pivot before calculating the "Live Slope" (Default: 3).
Dashboard Settings
Show Dashboard : Toggle the table on/off.
Timeframe Toggles : Enable/Disable specific timeframes (1m, 5m, 15m, 30m, 1H, 4H, 1D, 1W, 1M) to suit your trading style.
🎯 How to Use
Wait for Background Change : When the background turns Teal, it indicates that a corrective pullback has ended and a new impulse with high velocity has begun.
Check Invalidation : Look at the plotted Stop Loss Level. If price closes below this line, the trade idea is invalid.
Confirm with Dashboard : Use the table to ensure the higher timeframes (e.g., 1H, 4H) align with your current chart's direction for higher probability setups.
Disclaimer : This tool is designed for trend analysis and educational purposes. Past performance (momentum) is not indicative of future results. Always manage your risk.

GTI BGTI: RSI Suite (Standard • Stochastic • Smoothed)
A three-layer momentum and trend toolkit that combines Standard RSI, Stochastic RSI, and a Smoothed/“Macro” RSI to help you read intraday swings, trend transitions, and high-probability reversal/continuation spots.
All in one pane with intuitive coloring and optional divergence markers and alerts.
Why this works
* Stochastic RSI (K/D) visualizes fast momentum swings and timing.
* Standard RSI moves more gradually, helping confirm trend transitions that may span several Stochastic cycles.
* Smoothed RSI (Average → Macro) adds a second-pass filter and slope persistence to reveal the macro direction while suppressing noise.
Used together, Stochastic guides entries/exits around local highs/lows, while the RSI layers improve confidence when a small swing is likely part of a larger turn.
What you’ll see
* Standard RSI (yellow; pink above Bull line, aqua below Bear line).
* Stochastic RSI (K/D) with contextual colors:
* Greens when RSI is weak/oversold (bearish conditions → watch for bullish reversals/continuations).
* Reds when RSI is strong/overbought (bullish conditions → watch for bearish reversals/continuations).
* Smoothed (Macro) RSI with trend color:
* Red when macro is ascending (bullish),
* Aqua when macro is descending (bearish).
* Divergences (optional markers):
* Bearish: RSI Lower High + Price Higher High (red ⬇).
* Bullish: RSI Higher Low + Price Lower Low (green ⬆).
* No repaint: pivots confirm after the chosen right-bars window.
How to use it
* Bullish Reversal
* Macro RSI is reversing at a higher low after price has been in a overall downtrend
* Stochastic RSI is switching from green to red in an overall downtrend
* Bullish Oversold
* Macro RSI is reversing from a significantly low level after price has a short but strong dip during an overall uptrend
* Stochastic RSI is switching from green to red in an overall uptrend
* Bullish Continuation
* Macro RSI is ascending with a strong slope or forming a higher low above the 50 line
* Stochastic RSI is reaching a bottom but still painted red
* Bearish Reversal
* Macro RSI is reversing at a lower high after price has been in a overall uptrend
* Stochastic RSI is switching from red to green in an overall uptrend
* Bearish Overbought
* Macro RSI is reversing from a significantly high level after price has a short but strong jump during an overall downtrend
* Stochastic RSI is switching from red to green in an overall downtrend
* Bearish Continuation
* Macro RSI is descending with a strong slope or forming a lower high below the 50 line
* Stochastic RSI is reaching a top but still painted green
* Divergences: Use as signals of exhaustion—best when aligned with Macro RSI color/slope and key levels (e.g., Bull/Bear lines, 50 midline).
*** IMPORTANT ***
* Stack confluence, don’t single-signal trade. Look for:
* 1) Macro RSI color & slope (red = ascending/bullish, aqua = descending/bearish)
* 2) Standard RSI location (above/below Bull/Bear lines or 50)
* 3) Stoch flip + direction
* 4) Price structure (HH/HL vs LH/LL)
* 5) Divergence type (regular vs hidden) at meaningful levels
* Trade with the macro
* Prioritize longs when Macro RSI is red or just flipped up
* Prioritize shorts when Macro RSI is aqua or just flipped down
* Counter-trend setups = smaller size and faster management.
* Location > signal
* The same crossover/divergence is higher quality near Bull (~60)/Bear(~40) or extremes than in the mid-range chop around 50.
* Early vs confirmed
* Use the early pivot heads-up for anticipation, but scale in only after the confirmed pivot (right-bars complete). If early signal fails to confirm, stand down.
* Define invalidation upfront
* For divergence entries, place stops beyond the pivot extreme (LL/HH). If Macro RSI flips against your trade or RSI breaks back through 50 with slope, exit or tighten.
* Multi-timeframe alignment
* Best results come when entry timeframe (e.g., 1H) aligns with higher-TF macro (e.g., 4H/D). If they disagree, treat it as mean-reversion only.
* Avoid common traps
* Skip: isolated Stochastic flips without RSI support, divergences without price HH/LL confirmation, and serial divergences when Macro RSI slope is strong against the idea.
* Parameter guidance
* Start with defaults; then tune: confirmBars 3–7, minSlope 0.05–0.15 RSI pts/bar, pivot left/right tighter for faster but noisier signals, wider for cleaner but fewer.
* Alerts = workflow, not auto-trades
* Use Macro Flip + Divergence alerts as a checklist trigger; enter only when your confluence rules are met and risk is defined.
Key inputs (tweak to your market/timeframe)
* RSI / Stochastic lengths and K/D smoothing.
* Bull / Bear Lines (default 61.1 / 43.6).
* Average RSI Method/Length (SMA/EMA/RMA/WMA) + Macro Smooth Length.
* Trend confirmation: bars of persistence and minimum slope to reduce flip noise.
* Pivot look-back (left/right) for divergence confirmation strictness.
Alerts included
* Macro Flip Up / Down (Smoothed RSI regime change).
* RSI Bullish/Bearish Divergence (confirmed at pivot).
* Stochastic RSI continuation/divergence (optional).
Tips
* Level + Slope matter. High/low RSI level flags conditions; slope confirms impulse/continuation.
* Let Stochastic time the swing; let Macro RSI filter the trend.
* Tighten or loosen pivot windows to trade fewer/cleaner vs. more/faster signals.

Universal Direction EstimatorUniversal Direction Estimator V1
Overview
The Universal Direction Estimator V1 is a Pine Script v6 indicator that unifies Trend, Momentum, and Market-Structure readings into a single normalized score ranging from −1 to +1. It can optionally reference a higher timeframe (HTF) for confirmation and apply a custom Wilder-style ADX confidence boost to highlight conditions where directional bias is statistically stronger.
It’s designed as an interpretable directional meter – providing a quick visual estimate of whether short-term forces favor upward, downward, or neutral movement.
How It Works
The model produces three independent sub-scores each normalized to the −1 to +1 range:
• Trend Component (EMA-Spread): Measures distance between a fast and slow EMA, scaled by ATR and passed through a smooth tanh function to stabilize extremes.
• Momentum Component (ROC): Captures short-term velocity using rate-of-change over a configurable window.
• Structure Component (Market Structure): Detects new highs or lows within a rolling bar window and otherwise uses the deviation of price from a mid-SMA to express bias.
A weighted blend (default = 45 % Trend / 35 % Momentum / 20 % Structure) forms the base score.
Optional modules then refine it:
• HTF Alignment Bonus: When both local and higher-timeframe direction share the same sign, the score receives a small positive adjustment; disagreement slightly reduces confidence.
• ADX Confidence Boost: A self-contained Wilder-style +DI / −DI / DX calculation raises the score’s magnitude when measured trend strength exceeds a user threshold.
• The final bounded result determines one of three discrete states:
UP (score > 0.10), DOWN (score < −0.10), or NEUTRAL (inside the dead-zone).
Visual and Functional Features
• Candle Coloring: Optional shading of bars by current directional state.
• Direction Trail : A smoothed overlay of the score for visual continuity.
• Flip Markers: Up/Down triangles plotted when the estimator changes state.
• S tatus Table: Compact on-chart panel listing Direction, Score %, individual component weights, ADX value, and HTF alignment flag.
• Alerts: Built-in conditions trigger “Direction Flip: UP” / “Direction Flip: DOWN.”
Why It’s Original
Rather than relying on a single legacy indicator, this tool fuses three orthogonal measures into a unified confidence-weighted direction index, with both adaptive normalization and a bespoke ADX engine that avoids ta.adx(). The method produces a consistent −1 to +1 score applicable across instruments and timeframes, suitable for comparative scanning or overlay visualization.
It’s not a clone of classic moving-average or momentum systems; its novelty lies in the weighted, bounded integration and multi-timeframe coherence adjustment that makes directional interpretation more stable and portable between markets.
Configuration & Usage Notes
• Timeframes: Enter a higher-TF (e.g., 60, 240, D) and enable Use HTF Confirmation to activate cross-timeframe logic.
• Lengths & Weights: Adjust EMA, ROC, and Structure lookbacks and their blend ratios to tune sensitivity.
• Confidence Filter: Modify ADX length and threshold to emphasize stronger trends.
• Visual Controls: Toggle candle colors, trail line, arrows, and status table to fit your chart layout.
This estimator can be paired with other analytical overlays (volume, volatility, structure) for study purposes, but it is not designed to issue automated trade entries or exits.
Legal Disclaimer
This indicator is for charting and educational use only and does not constitute financial advice, trading signals, or performance claims. Markets involve risk, including the loss of principal. Past performance does not guarantee future results. Use at your own discretion and consult a qualified professional before making financial decisions. Provided “as is,” without warranties

Symmetry Break Index | QRSymmetry Break Trend Scanner | QuantumResearch
What it does
This indicator detects trend regime shifts by measuring how persistently price deviates from its moving-average “symmetry.” It outputs a continuous Score and a binary Signal (Bullish / Bearish) when that score crosses user-defined thresholds:
Bullish (Long) when upside deviations dominate → sustained uptrend bias
Bearish (Short/Cash) when downside deviations dominate → sustained downtrend bias
It’s built for clarity and consistency: the plot is a single score with two horizontal decision lines so traders can quickly identify regime changes on a clean chart.
How it works (principle, not code)
Normalize price vs trend: Price is standardized against a moving average and its standard deviation to create a dimensionless “oscillator” series (how far above/below typical behavior price sits).
Symmetry count: For a user-defined range of reference levels, the script counts whether the standardized price is above or below each level. This builds a cumulative symmetry score: positive when upside presence is broad and persistent, negative when downside dominates.
Regime thresholds: Crossing the Uptrend Threshold or Downtrend Threshold flips the quantum state to Bullish or Bearish, minimizing noise compared with a single-level trigger.
This approach emphasizes persistence and breadth of deviation rather than one-off spikes, which can help filter chop.
Plots & visuals
Score (histogram/area fill): Positive area fills in the bullish color, negative area in the bearish color.
Zero line: Quick reference for balance between up/down deviations.
Two decision lines: Uptrend Threshold and Downtrend Threshold to mark regime flips.
Bar colors: Bars tint with the active regime (Bullish / Bearish) for fast reads.
Publish with a clean chart so the score and thresholds are clearly visible. Avoid extra indicators unless they are required and explained.
Inputs & customization
MA Length (default 40): Window for the baseline moving average and volatility. Shorter = more reactive; longer = smoother.
Source: Price input (e.g., close).
For Loop Range (Start / End, default −200…200): Breadth of reference levels in the symmetry count. Wider range = stronger smoothing and slower flips.
Uptrend / Downtrend Thresholds: Regime triggers. Tighten to react faster, widen to reduce whipsaws.
Color Mode: Choose a palette to match your chart.
Tip: Start with defaults, then tune MA Length and thresholds for your market/timeframe.
How to use it
Trend confirmation: Trade in the direction of the active regime; avoid counter-trend setups when the score is far beyond a threshold.
Risk controls: When the score retreats toward zero, consider reducing size or tightening stops—momentum is weakening.
Confluence: Combine with structure (S/R), volume, or volatility bands for entries/exits; the score provides context, not entries alone.
Originality & value
Unlike single-threshold oscillators, this method aggregates many standardized comparisons into one score, rewarding persistence and breadth of deviation. The result is a robust regime signal that tends to filter fleeting wiggles and highlight true symmetry breaks.
Limitations
Extremely range-bound markets can still produce false flips if thresholds are too tight.
Sudden volatility regime changes may require re-tuning MA Length or thresholds.
Standardization depends on the chosen window; there is no “one size fits all.”
Disclaimer
This tool is for research/education and is not financial advice. Markets involve risk, including loss of capital. Past performance does not predict or guarantee future results. Always test settings on your timeframe and use prudent risk management.
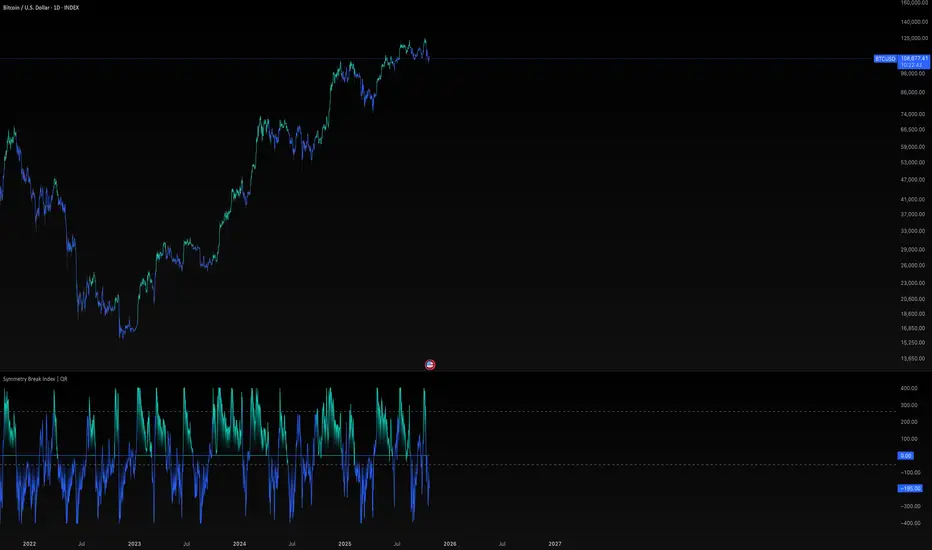
ZZ RangeHappy Trading!
This is a real-time range detection indicator. Based on previous supply and demand levels, it classifies each new bar as Up, Down, or Range.
New supply and demand levels are typically detected within two bars. The indicator can be used as a filter and supports indicator-on-indicator functionality.
Intro
Concept
Usage and Settings Menu
Declaration for TradingView House Rules on Script Publishing
Disclaimer
1. Concept
Based on a variation of the Bilson-Gann Algorithm, this indicator calculates local supply and demand levels and determines whether the current price is:
Between those levels → Ranging
Above → Uptrending
Below → Downtrending
Less significant supply and demand levels are filtered out using a user-adjustable intensity setting.
2. Usage and Settings Menu
There are four settings available:
Indicator Timeframe – Display results from higher timeframes on the lower timeframe chart.
Range Detection Rule – Choose whether a bar must be fully inside supply and demand zones to be considered ranging, or if touching the zone is sufficient.
Bar Structure Basis – Select whether wicks or bodies of bars are used to calculate supply and demand levels.
Rule to set S&D – Choose among three rules defining how often new supply and demand levels are calculated. Each rule adjusts the sensitivity and responsiveness of detection.
Alert Signals Available:
Trend Signal 1 = Uptrend, 0 = Ranging, -1 = Downtrend
last supply Level
last demand Level
3. Declaration for TradingView House Rules on Script Publishing
The unique feature of ZZ Range is its real-time range detection capability.
This script is closed-source and invite-only, to support and compensate for months of development work.
4. Disclaimer
Trading involves risk, and losses can and do occur. This script is intended for informational and educational purposes only. All examples are hypothetical and not financial advice.
Decisions to buy, sell, hold, or trade securities, commodities, or other assets should be based on the advice of qualified financial professionals. Past performance does not guarantee future results.
Use this script at your own risk. It may contain bugs, and I cannot be held responsible for any financial losses resulting from its use.
Cheers!

FVG Zones with Signals█ OVERVIEW
"FVG Zones with Signals" is a technical analysis tool that identifies Fair Value Gaps (FVG) on the chart and draws customizable zones in the form of boxes. It is ideal for traders using price action and market structure strategies, helping to identify potential imbalance zones and trading opportunities based on breakout and exit signals. With flexible size filter settings, box styles, and signal options, the indicator ensures clarity and precision on the chart.
█ CONCEPTS
The indicator is designed to identify potential entry points for trades based on FVG breakouts or retests. For chart clarity, a size filter for FVGs is included, based on a multiplier of the average candle size over a specified period.
Why are FVGs important? FVG zones represent areas of market imbalance, often attracting price back to "fill" the gap. Larger gaps (with a higher size multiplier) have a greater chance of being retested, as they indicate deeper imbalances—leaving more unexecuted orders in those zones, which attracts liquidity. Market makers and institutions often return to these levels to "refresh" liquidity before further moves. However, not every large FVG is retested quickly—in strong trends, smaller imbalances may be ignored, and the location (e.g., near swing highs/lows) is critical for retest probability.
█ FEATURES
- FVG Detection: Identifies bullish and bearish FVGs based on size filters (Candle Size Period and FVG Size Multiplier), with automatic initialization of historical gaps up to 500 candles back.
- Customizable Boxes: Draws FVG boxes with adjustable border colors, background gradients, border styles (solid, dashed, dotted), border widths, and transparency for both the background and the 50% FVG midline.
- Breakout and Exit Signals: Generates "Break" signals (green upward triangle for breakouts above bearish FVG, red downward triangle for breakouts below bullish FVG) and "Exit" signals (circles for exiting the zone), with options to select signal types (Break, Exit, or Both). A break signal causes the box to disappear, leaving a triangle as a trace of the breakout, which may serve as a signal to open a position. Exit signals (circles) may also indicate entry opportunities but require additional confirmation, such as alignment with the main trend.
- Midline: Automatically draws a dashed line at the 50% FVG level with adjustable transparency, aiding in assessing price reactions within the zone.
- Box Limitation: Automatically removes old or inactive FVGs after 500 candles to avoid chart clutter.
- Alerts: Built-in alerts for all signal types, including price and FVG type descriptions.
█ HOW TO USE
Add to Chart: Apply the indicator to your TradingView chart via the Pine Editor or Indicators menu.
Configure Settings:
- FVG Settings: Adjust Candle Size Period (default 20) and FVG Size Multiplier (default 1) to filter out small gaps—higher values generate fewer but more significant FVGs.
- Box Settings: Configure colors and styles for bullish (green) and bearish (red) boxes, including background transparency (default 80) and midline transparency.
- Signal Settings: Select signal types (Break, Exit, or Both) in Signal Type. Breakout signals appear after a candle closes outside the zone, while exit signals appear when exiting an FVG without a full breakout.
- Styling: Customize signal colors (green for buy/up, red for sell/down) and shape sizes.
Interpreting Signals:
- Break Up Signal: A green triangle below the bar indicates a breakout above a bearish FVG, suggesting potential continuation of an uptrend.
- Break Down Signal: A red triangle above the bar indicates a breakout below a bullish FVG, suggesting potential continuation of a downtrend.
- Exit Up/Down Signal: A green/red circle indicates an exit from an FVG without a full breakout, which may signal the end of a correction or preparation for a reversal.
- FVG Zones: If the price returns to an FVG and fills the gap, it may indicate equilibrium; an unfilled gap often leads to a retest.
- Use signals in conjunction with other technical analysis tools for confirmation, such as RSI (to identify overbought/oversold conditions) or MACD (to confirm momentum). Analyze FVGs from higher timeframes—these zones act as stronger imbalance levels and carry greater structural significance.
Exit signals (retests without breakouts) tend to be most effective when traded in line with the current trend.
█ APPLICATIONS
- Price Action Trading: Use FVG zones as dynamic support and resistance levels. In an uptrend, look for buying opportunities in bullish FVGs, where price often tests the gap before continuing. Combining with RSI, MACD, or Fibonacci levels enhances the significance of zones.
- Breakout Strategies: Trade based on breakout signals from FVGs. A buy signal after breaking a bearish FVG may indicate a strong upward impulse, especially when supported by a rising MACD or RSI exiting oversold conditions.
Larger FVG gaps (higher multiplier) have a greater chance of retest, as they indicate deeper imbalances.
█ NOTES
- Test the indicator across different timeframes and markets (stocks, forex, crypto) to optimize size filters for your trading style.
- The indicator initializes historical FVGs up to 500 candles back, which may slow loading on longer charts.
- For best results, use on high-liquidity markets where FVGs are more frequently retested.
- In consolidation zones, the indicator may generate more false signals, so additional confirmation is recommended.

Cumulative Volume DeltaCumulative Volume Delta (CVD) Indicator
This indicator is a modification of the Trading View CVD indicator. Cumulative Volume Delta (CVD), which represents the net difference between up volume (volume traded as the price increases) and down volume (volume traded as the price decreases) over a chosen Anchor Period.
The data for the CVD calculation is requested using the built-in ta.requestVolumeDelta function from a lower timeframe to approximate the directional volume with greater precision. This lower timeframe is either automatically selected based on the chart's timeframe or can be customized by the user.
Key Features and Inputs
Anchor Period: Defines the period over which the volume delta is accumulated and plotted. The default is "1D" (Daily), but it can be changed to any higher timeframe (e.g., "1W" for Weekly) to analyze CVD across different cycles.
CVD Candle Plot: The calculated volume delta values are plotted as a custom candle, where:
The open and close of the CVD candle represent the volume delta at the start and end of the anchor period, respectively.
The high and low represent the maximum and minimum volume delta reached during that period.
Up/Down Coloring Logic: The color of the CVD candle is determined by the directional movement of the price during the anchor period, allowing traders to quickly correlate volume delta with price action. Users can select between two methods via the "Strong Up/Down Coloring" input:
Strong Up/Down (Default): The candle is colored bullish (Teal) if the current price closes above the previous bar's high or bearish (Red) if it closes below the previous bar's low. This logic highlights significant momentum.
Regular Up/Down: The candle is colored bullish (Teal) if the close is greater than the open (price moved up) or bearish (Red) if the close is less than the open (price moved down).
Lower Timeframe Selection: This determines the resolution of the up and down volume components.
By default, the script automatically selects an appropriate lower timeframe (e.g., "1" minute for intraday charts, "5" minutes for daily charts) to balance historical data availability with calculation precision.
An option is provided to customize this "Lower Timeframe" for advanced users seeking higher or lower resolution.
The CVD indicator is a powerful tool for analyzing order flow dynamics and assessing the genuine strength of price movements by comparing the aggregate buying pressure (up volume) against the selling pressure (down volume).
Technical Notes (Code Details)
Language: Pine Script® //@version=6.
Function: Utilizes the ta.requestVolumeDelta() function with a user-defined anchorInput (default "1D") and a determined lowerTimeframe to retrieve the relevant delta data: .
Error Handling: Includes a check to confirm the symbol provides volume data, preventing runtime errors.

Phantom Trend IndicatorOverview
The Phantom Trend Indicator (PTI) is a streamlined tool for identifying trend direction and strength. It blends zigzag-based trend detection with a volume profile to display a histogram showing price distance from the Point of Control (POC). Six distinct colors highlight trend states, with background highlights for extreme price zones. Ideal for stocks, forex, crypto, and futures across any timeframe.
Features:
Trend Detection: Uses zigzag fractals to identify uptrends and downtrends.
Histogram Colors: Six colors for trend strength (low, high, extreme for up/down trends) or neutral (gray).
Dynamic Levels: Plots POC, Value Area Low (VAL), and High (VAH) via volume profile.
Background Colors: Highlights overbought (above VAH) or oversold (below VAL) zones.
Alerts: Signals new trends.
How It Works:
Trends: Zigzag fractals define trend ranges, with price position setting histogram colors (low, high, or extreme).
Histogram: Shows price deviation from POC.
Background: Colors extreme zones outside VAL/VAH.
This indicator builds on traditional trend detectors and volume profiles by integrating them into a single, cohesive tool. Unlike standard momentum indicators that rely on moving averages, PTI uses zigzag fractals for more responsive trend identification, reducing lag in volatile markets. Compared to basic volume profile scripts, it adds trend-based color coding and background alerts for extremes, providing clearer visual cues for overbought/oversold conditions. The six distinct colors indicate trend strength, and customizable thresholds allow fine-tuning for different assets and timeframes, enhancing adaptability. Traders benefit from combined momentum and liquidity insights, helping spot reversals or continuations more reliably—making PTI a valuable, standalone addition for both novice and experienced users.
Settings
Trend Detector: Toggle alerts, adjust zigzag sensitivity, and set thresholds for low-to-high and extreme color transitions.
Dynamic Levels: Configure volume profile period, multiplier, accuracy, value area percent, and ATR-based channel width.
Visuals: Customize POC, VAL, VAH, and area fill colors.
Read Histogram: Uptrend colors show early, strong, or overextended moves; downtrend colors indicate early, weakening, or oversold conditions; gray for consolidation.
Background: Monitor for overbought/oversold color-coded signals.
Tune: Adjust zigzag or period settings for your timeframe/asset.
Tips
Shorten period for intraday, extend for swing trading.
Pair with other indicators for confirmation.
Notes:
Requires sufficient chart data for volume profile.
Test settings for low-volatility assets.
For informational use only, not financial advice. Test thoroughly, and happy trading!

Multiple Colored Moving AveragesMULTIPLE COLORED MOVING AVERAGES - USER GUIDE
DISCLAIMER
----------
Both the code and this documentation were created heavily using artificial intelligence. I'm lazy...
This indicator was inspired by repo32's "Moving Average Colored EMA/SMA" indicator. *
What is this indicator?
-----------------------
This is a TradingView indicator that displays up to 4 different moving averages on your chart simultaneously. Each moving average can be customized with different calculation methods, colors, and filtering options.
Why would I use multiple moving averages?
-----------------------------------------
- See trend direction across different timeframes at once
- Identify support and resistance levels
- Spot crossover signals between fast and slow MAs
- Reduce false signals with filtering options
- Compare how different MA types react to price action
What moving average types are available?
----------------------------------------
11 different types:
- SMA: Simple average, equal weight to all periods
- EMA: Exponential, more weight to recent prices
- WMA: Weighted, linear weighting toward recent data
- RMA: Running average, smooth like EMA
- DEMA: Double exponential, reduced lag
- TEMA: Triple exponential, even less lag
- HMA: Hull, fast and smooth combination
- VWMA: Volume weighted, includes volume data
- LSMA: Least squares, based on linear regression
- TMA: Triangular, double-smoothed
- ZLEMA: Zero lag exponential, compensated for lag
How do I set up the indicator?
------------------------------
Each MA has these settings:
- Enable/Disable: Turn each MA on or off
- Type: Choose from the 11 calculation methods
- Length: Number of periods (21, 50, 100, 200 are common)
- Smoothing: 0-10 levels of extra smoothing
- Noise Filter: 0-5% to ignore small changes
- Colors: Bullish (rising) and bearish (falling) colors
- Line Width: 1-5 pixels thickness
What does the smoothing feature do?
-----------------------------------
Smoothing applies extra calculations to make the moving average line smoother. Higher levels reduce noise but make the MA respond slower to price changes. Use higher smoothing in choppy markets, lower smoothing in trending markets.
What is the noise filter?
--------------------------
The noise filter ignores small percentage changes in the moving average. For example, a 0.3% filter will ignore any MA movement smaller than 0.3%. This helps eliminate false signals from minor price fluctuations.
When should I use this indicator?
---------------------------------
- Trend analysis: See if market is going up, down, or sideways
- Entry timing: Look for price bounces off MA levels
- Exit signals: Watch for MA slope changes or crossovers
- Support/resistance: MAs often act as dynamic levels
- Multi-timeframe analysis: Use different lengths for different perspectives
What are some good settings to start with?
-------------------------------------------
Conservative approach:
- MA 1: EMA 21 (short-term trend)
- MA 2: SMA 50 (medium-term trend)
- MA 3: SMA 200 (long-term trend)
- Low noise filtering (0.1-0.3%)
Active trading:
- MA 1: HMA 9 (very responsive)
- MA 2: EMA 21 (short-term)
- MA 3: EMA 50 (medium-term)
- Minimal or no smoothing
How do I interpret the colors?
------------------------------
Each MA changes color based on its direction:
- Bullish color: MA is rising (upward trend)
- Bearish color: MA is falling (downward trend)
- Gray: MA is flat or unchanged
What should I look for in crossovers?
-------------------------------------
- Golden Cross: Fast MA crosses above slow MA (bullish signal)
- Death Cross: Fast MA crosses below slow MA (bearish signal)
- Multiple crossovers in same direction can confirm trend changes
- Wait for clear separation between MAs after crossover
How do I use MAs for support and resistance?
---------------------------------------------
- In uptrends: MAs often provide support when price pulls back
- In downtrends: MAs may act as resistance on rallies
- Multiple MAs create support/resistance zones
- Stronger levels where multiple MAs cluster together
Can I use this with other indicators?
-------------------------------------
Yes, it works well with:
- Volume indicators for confirmation
- RSI or MACD for timing entries
- Bollinger Bands for volatility context
- Price action patterns for setup confirmation
What if I get too many signals?
-------------------------------
- Increase smoothing levels
- Raise noise filter percentages
- Use longer MA periods
- Focus on major crossovers only
- Wait for multiple MA confirmation
What if signals are too slow?
-----------------------------
- Reduce smoothing to 0
- Lower noise filter values
- Switch to faster MA types (HMA, ZLEMA, DEMA)
- Use shorter periods
- Focus on the fastest MA only
Which MA types work best in different markets?
----------------------------------------------
Trending markets: EMA, DEMA, TEMA (responsive to trends)
Choppy markets: SMA, TMA, HMA with smoothing (less whipsaws)
High volatility: Use higher smoothing and noise filtering
Low volatility: Use minimal filtering for better responsiveness
Do I need all the advanced features?
------------------------------------
No. Start with basic settings:
- Choose MA type and length
- Set colors you prefer
- Leave smoothing at 0
- Leave noise filter at 0
Add complexity only if needed to improve signal quality.
How do I know if my settings are working?
-----------------------------------------
- Backtest on historical data
- Paper trade the signals first
- Adjust based on market conditions
- Keep a trading journal to track performance
- Be willing to modify settings as markets change
Can I save different configurations?
------------------------------------
Yes, save different indicator templates in TradingView for:
- Different trading styles (scalping, swing trading)
- Different market conditions (trending, ranging)
- Different instruments (stocks, forex, crypto)

Session Volatility MonitorOverview
Session Volatility Monitor is a versatile volatility indicator tailored for intraday and session-based trading. It computes the average maximum price deviation (either up or down) from the session's opening price over a user-specified number of prior days, providing insights into expected "room to move" in the current session. This helps traders gauge potential exhaustion points, set realistic targets or stops, and identify when a directional move has reached historical norms (flagged as "REACHED" with the exact price level).
Displayed via a customisable table and optional horizontal target lines, it's ideal for markets like forex, crypto, futures, or stocks where session volatility matters. The indicator supports custom sessions with timezone adjustments, making it adaptable to global trading hours (e.g., London, NY, or Asia kill zones). For assets with small tick sizes (e.g., forex pairs at 0.0001), a multiplier scales values for readability (e.g., showing pips as 67.0 instead of 0.00670).
Key Features
Session-Based Calculations:
Defines sessions via presets (e.g., "NY Kill Zone: 07:00-10:00") or custom HHMM-HHMM inputs. (please note that preset sessions are mainly for futures e.g. "Full Day18:01-17:00", but also can be useful for forex and crypto)
Adjustable UTC offset (e.g., -5 for ET) to align with your asset's timezone—ensures accurate detection regardless of TradingView's UTC internal clock.
Tracks the max one-sided move (high - open or open - low) per session, averaging over 1–N previous days (default: 14).
Table Display:
Avg Max Move: Historical average deviation, labeled with days averaged and session time.
Current Move: Real-time displacement from session open (positive for up, negative for down).
Room to Go Up/Down: Remaining distance to reach the average, updating live; appends "REACHED (price)" if hit during the session.
Customisable: Text color, font size (tiny to huge), position (e.g., bottom_left), and value scaling via multiplier/decimal places.
Target Lines:
Optional horizontal lines at "Up Target" (open + avg move) and "Down Target" (open - avg move).
Lines start at the session open bar and extend only through the session duration (e.g., stops at 12:00 for a 07:00-12:00 session)—no further projection post-session.
Fully customisable: Toggle on/off, color, style (solid/dotted/dashed), width, label text/background.
Display Adjustments for Forex/Crypto:
Multiplier: Scales raw values (e.g., set to 10000 for EURUSD to show pips like 45.0 instead of 0.0045).
Decimals: Controls precision (0–5 places) for table values.
How to Use
Add to Chart: Search for "Session Volatility Monitor" in TradingView's indicators and apply to your symbol (e.g., EURUSD for forex, NQ1! for futures, BTCUSD for crypto).
Configure Settings:
Select a session preset or custom range; adjust UTC offset if needed (e.g., +0 for UTC symbols like crypto).
Set "Number of Previous Days to Average" (e.g., 14 for a two-week look back).
For small-tick assets, set Multiplier (e.g., 100 for crypto points, 10000 for forex pips) and Decimals (e.g., 0 for whole numbers).
Customise table position/size/color and target lines for visibility.
Interpret Outputs:
Monitor the table for "room to go"—if Room Up is low/negative, upside might be limited; "REACHED" signals a potential reversal or exhaustion.
Use target lines as visual S/R levels; they auto-start at session open and halt at close.
Combine with price action, volume, or other indicators for entries (e.g., buy near down target if bullish bias).
Example Scenario:
Forex (GBPUSD, 1-min): Set session to "London Kill Zone: 02:00-05:00" (UTC+0), multiplier=10000. Table shows pips; lines mark expected highs/lows.
Limitations and Tips
Historical Data Limits: Averages are capped by TradingView's bar history (e.g., ~14 days on 1-min for free plans). Upgrade for deeper look backs or use higher timeframes.
Session Accuracy: Ensure UTC offset matches your chart—test with the "In Session" plot (enable in Style tab, zoom y-axis if columns are tiny).
No Alerts/Signals: Purely informational; add custom alerts via TradingView for "REACHED" conditions.
Performance: On very low timeframes with long sessions, lines might consume line limits (max ~50)—toggle off if needed.
Tips: For crypto/forex, experiment with multiplier to match your preferred units (e.g., points vs. decimals). Hide debug plot in Style tab for clean charts. If "REACHED" doesn't trigger, verify on historical data where moves exceed averages.
This tool draws from concepts like Average Daily Range but focuses on directional, session-specific volatility for precise intraday decision-making. Feedback welcome!
Disclaimer
This indicator is for educational purposes only and does not constitute financial advice. Always consult a professional before trading.

Smart Money Breakout Channels [AlgoAlpha]🟠 OVERVIEW
This script draws breakout detection zones called “Smart Money Breakout Channels” based on volatility-normalized price movement and visualizes them as dynamic boxes with volume overlays. It identifies temporary accumulation or distribution ranges using a custom normalized volatility metric and tracks when price breaks out of those zones—either upward or downward. Each channel represents a structured range where smart money may be active, helping traders anticipate key breakouts with added context from volume delta, up/down volume, and a visual gradient gauge for momentum bias.
🟠 CONCEPTS
The script calculates normalized price volatility by measuring the standard deviation of price mapped to a scale using the highest and lowest prices over a set lookback period. When normalized volatility reaches a local low and flips upward, a boxed channel is drawn between the highest and lowest prices in that zone. These boxes persist until price breaks out, either with a strong candle close (configurable) or by touching the boundary. Volume analysis enhances interpretation by rendering delta bars inside the box, showing volume distribution during the channel. Additionally, a real-time visual “gauge” shows where volume delta sits within the channel range, helping users spot pressure imbalances.
🟠 FEATURES
Automatic detection and drawing of breakout channels based on volatility-normalized price pivots.
Optional nested channels to allow multiple simultaneous zones or a clean single-zone view.
Gradient-filled volume gauge with dynamic pointer to show current delta pressure within the box.
Three volume visualization modes: raw volume, comparative up/down volume, and delta.
Alerts for new channel creation and confirmed bullish or bearish breakouts.
🟠 USAGE
Apply the indicator to any chart. Wait for a new breakout box to form—this occurs when volatility behavior shifts and a stable range emerges. Once a box appears, monitor price relative to its boundaries. A breakout above suggests bullish continuation, below suggests bearish continuation; signals are stronger when “Strong Closes Only” is enabled.
Watch the internal volume candles to understand where buy/sell pressure is concentrated during the box. Use the gauge on the right to interpret whether net pressure is building upward or downward before breakout to anticipate the direction.
Use alerts to catch breakout events without needing to monitor the chart constantly 🚨.

52SIGNAL RECIPE Coinbase Institutional Smart Money DetectorCoinbase Institutional Smart Money Detector
◆ Overview
Coinbase Institutional Smart Money Detector is an innovative indicator that detects the buying and selling movements of institutional investors through Coinbase Prime in real-time. This powerful tool tracks the flow of funds from large institutions to provide valuable signals before significant market direction changes occur. It can be applied to Bitcoin charts on any exchange, allowing traders to follow the "smart money" movements of institutions anytime, anywhere.
The unique strength of this indicator lies in its comprehensive assessment of institutional investors' consecutive trading behaviors, volume patterns, and trend strength by analyzing Coinbase data in real-time. By providing clear visual representation of institutional fund flow data that is difficult for ordinary traders to access, you gain the opportunity to move alongside the big players in the market.
─────────────────────────────────────
◆ Key Features
• Coinbase Prime Data Analysis: Tracks institutional movements in real-time by analyzing data from Coinbase Prime, an institutional-only service
• Real-time Institutional Fund Flow Monitoring: Immediately detects large institutions' spot buying/selling activities, allowing positioning ahead of the market
• Universal Exchange Compatibility: Applicable to Bitcoin charts on any exchange, enabling use on your preferred trading platform
• Institutional Continuity Analysis: Identifies continuous institutional activity by tracking consecutive buying/selling patterns
• Smart Volume Analysis: Detects increased volume compared to averages and analyzes key trading time periods
• Trend Strength Measurement: Quantifies and displays the strength of upward/downward trends by analyzing candle patterns
• Intuitive Visualization: Clearly marks institutional activity points on charts through bar coloring and labels
• Real-time Strength Display: Calculates and displays current trend strength in a table in real-time
• Customizable Settings: Allows customization of key parameters to match your trading style
─────────────────────────────────────
◆ Understanding Signal Types
■ Institutional Buy Signal
• Definition: Occurs when institutional investors show consecutive buying activity through Coinbase Prime, accompanied by increased volume and strong upward trend
• Visual Representation: Translucent blue bar coloring and "Institution Buying Detected!" label on the candle where the buy signal occurs
• Market Interpretation: Indicates that institutional investors are actively buying spot Bitcoin, which is likely to lead to price increases
• Signal Strength Factors:
▶ Consecutive price increase patterns
▶ Above-average volume
▶ Strong upward trend strength measurement
▶ Significant price movement
■ Institutional Sell Signal
• Definition: Occurs when institutional investors show consecutive selling activity through Coinbase Prime, accompanied by increased volume and strong downward trend
• Visual Representation: Translucent pink bar coloring and "Institution Selling Detected!" label on the candle where the sell signal occurs
• Market Interpretation: Indicates that institutional investors are actively selling spot Bitcoin, which is likely to lead to price decreases
• Signal Strength Factors:
▶ Consecutive price decrease patterns
▶ Above-average volume
▶ Strong downward trend strength measurement
▶ Significant price movement
─────────────────────────────────────
◆ Understanding Trend Strength
■ Trend Strength Measurement Method
• Definition: Measures trend strength by analyzing the ratio of up/down candles over a recent period
• Visual Representation: Displayed in the table as "BULL STRENGTH" or "BEAR STRENGTH" with percentage value and "STRONG" or "WEAK" status
• Strength Threshold: Strong/weak determination according to user-configurable threshold
• Calculation Method:
▶ Upward trend strength = (Number of upward candles) / (Total analysis period)
▶ Downward trend strength = (Number of downward candles) / (Total analysis period)
▶ Displayed as "STRONG" when strength is above threshold, "WEAK" when below
■ Utilizing Trend Strength
• Signal Filtering: Generates signals only when trend strength is strong, reducing false signals
• Trend Confirmation: Evaluates the health and sustainability of the current market trend
• Entry/Exit Decisions: Consider entering in strong trends and exiting when trends weaken
• Risk Management: Develop strategies to reduce position size in weak trends and increase in strong trends
─────────────────────────────────────
◆ Practical Trading Applications
■ Institutional Buy Signal Strategy
• Trend Reversal Scenario:
▶ Setup: Strong institutional buy signal during a downtrend
▶ Entry: Buy after signal confirmation in the next candle
▶ Stop Loss: Below the low of the signal candle
▶ Take Profit: When reaching previous major resistance or when trend strength weakens
• Trend Continuation Scenario:
▶ Setup: Institutional buy signal after correction in an uptrend
▶ Entry: Buy after signal confirmation
▶ Stop Loss: Below recent major low
▶ Take Profit: Gradually take profits considering trend strength
■ Institutional Sell Signal Strategy
• Trend Reversal Scenario:
▶ Setup: Strong institutional sell signal during an uptrend
▶ Entry: Sell after signal confirmation in the next candle
▶ Stop Loss: Above the high of the signal candle
▶ Take Profit: When reaching previous major support or when trend strength weakens
• Trend Continuation Scenario:
▶ Setup: Institutional sell signal after bounce in a downtrend
▶ Entry: Sell after signal confirmation
▶ Stop Loss: Above recent major high
▶ Take Profit: Gradually take profits considering trend strength
■ Multi-Timeframe Approach
• Higher Timeframe Direction Confirmation:
▶ Check institutional signals and trend strength on daily/4-hour charts
▶ Use for setting main trading direction
• Lower Timeframe Entry Point Finding:
▶ Wait for lower timeframe signals that align with higher timeframe direction
▶ Use for capturing precise entry points
• Cross-Timeframe Signal Alignment:
▶ Signal strength increases when signals occur in the same direction across multiple timeframes
▶ Capture high-probability trading opportunities
─────────────────────────────────────
◆ Indicator Settings Guide
■ Main Setting Parameters
• Institutional Continuity Period:
▶ Purpose: Sets the period to check institutional consecutive buying/selling activity
▶ Lower value: Generates more signals, increases responsiveness
▶ Higher value: Reduces number of signals, increases reliability
• Trend Strength Threshold:
▶ Purpose: Sets the minimum threshold for determining strong trends
▶ Lower value: More signals, less filtering
▶ Higher value: Generates signals only in stronger trends, higher filtering
─────────────────────────────────────
◆ Synergy with Other Indicators
• Support/Resistance Levels:
▶ Institutional signals occurring at key support/resistance levels have higher probability
▶ Combination of key technical analysis levels and institutional activity provides powerful signals
• Moving Averages:
▶ Pay attention to institutional signals near key moving averages (50MA, 200MA)
▶ Strong trend change possibility when moving average crossovers coincide with institutional signals
• RSI/Momentum Indicators:
▶ Institutional buy signals in oversold conditions increase reversal probability
▶ Institutional sell signals in overbought conditions increase reversal probability
• Volume Profile:
▶ Institutional signals at high volume nodes confirm important price levels
▶ Institutional activity in key trading areas greatly impacts price direction
• Market Structure:
▶ Institutional signals near key market structures (higher highs/lows, lower highs/lows) suggest structural changes
▶ Coincidence of market structure changes and institutional activity indicates important trend turning points
─────────────────────────────────────
◆ Conclusion
Coinbase Institutional Smart Money Detector provides traders with valuable insights by tracking spot Bitcoin trading activities of institutional investors through Coinbase Prime in real-time. Because it can be applied to Bitcoin charts on any exchange, you can utilize it immediately on your preferred trading platform.
The core value of this indicator is providing intuitive visualization of institutional fund flow data that is difficult for ordinary traders to access. By comprehensively analyzing consecutive price movements, volume increases, and trend strength to capture institutional activity, you gain the opportunity to move alongside the big players in the market.
Clear buy/sell signals based on Coinbase Prime data and real-time trend strength measurements help traders quickly grasp market conditions and make strategic decisions. By integrating this powerful tool into your trading strategy, secure a competitive edge to understand where the market's smart money is flowing and position accordingly.
─────────────────────────────────────
※ Disclaimer: Like all trading tools, the Institutional Smart Money Detector should be used as a supplementary indicator and not relied upon exclusively for trading decisions. Past patterns of institutional behavior may not guarantee future market movements. Always employ appropriate risk management strategies in your trading.
Coinbase Institutional Smart Money Detector
◆ 개요
Coinbase Institutional Smart Money Detector는 코인베이스 프라임(Coinbase Prime)을 통한 기관 투자자들의 현물 비트코인 매수/매도 움직임을 실시간으로 감지하는 혁신적인 지표입니다. 이 강력한 도구는 대형 기관들의 자금 흐름을 추적하여 중요한 시장 방향 전환이 일어나기 전에 귀중한 신호를 제공합니다. 어떤 거래소의 비트코인 차트에도 적용 가능하여 트레이더들이 언제 어디서든 기관의 "스마트 머니" 움직임을 따라갈 수 있게 해줍니다.
이 지표의 독보적인 강점은 코인베이스 데이터를 실시간으로 분석하여 기관 투자자들의 연속적인 매매 행동, 거래량 패턴, 그리고 추세 강도를 종합적으로 평가한다는 점입니다. 일반 트레이더들이 접근하기 어려운 기관 자금 흐름 데이터를 시각적으로 명확하게 제공함으로써, 여러분은 시장의 큰 손들과 함께 움직일 수 있는 기회를 얻게 됩니다.
─────────────────────────────────────
◆ 주요 특징
• 코인베이스 프라임 데이터 분석: 기관 전용 서비스인 코인베이스 프라임의 데이터를 실시간으로 추적하여 기관의 움직임 포착
• 실시간 기관 자금 흐름 모니터링: 대형 기관들의 현물 매수/매도 활동을 즉각적으로 감지하여 시장에 앞서 포지셔닝 가능
• 모든 거래소 호환성: 어떤 거래소의 비트코인 차트에도 적용 가능하여 선호하는 트레이딩 플랫폼에서 활용 가능
• 기관 연속성 분석: 연속적인 매수/매도 패턴을 추적하여 기관의 지속적인 활동 식별
• 스마트 볼륨 분석: 평균 대비 거래량 증가를 감지하고 주요 거래 시간대를 분석
• 추세 강도 측정: 캔들 패턴을 분석해 상승/하락 추세의 강도를 수치화하여 표시
• 직관적 시각화: 바 컬러링과 라벨을 통해 기관 활동 지점을 차트에 명확하게 표시
• 실시간 강도 표시: 현재 추세의 강도를 실시간으로 계산하여 테이블에 표시
• 사용자 정의 설정: 주요 매개변수를 조정하여 자신의 트레이딩 스타일에 맞게 커스터마이징 가능
─────────────────────────────────────
◆ 신호 유형 이해하기
■ 기관 매수 신호
• 정의: 코인베이스 프라임을 통해 기관 투자자들이 연속적인 매수 활동을 보이며, 이와 함께 거래량 증가와 강한 상승 추세가 나타날 때 발생
• 시각적 표현: 매수 신호가 발생한 캔들에 반투명 파란색 바 컬러링과 함께 "Institution Buying Detected!" 라벨 표시
• 시장 해석: 기관 투자자들이 적극적으로 현물 비트코인을 매수하고 있으며, 이는 곧 가격 상승으로 이어질 가능성이 높음을 의미
• 신호 강도 요소:
▶ 연속적인 가격 상승 패턴
▶ 평균보다 높은 거래량
▶ 강한 상승 추세 강도 측정값
▶ 유의미한 가격 변동
■ 기관 매도 신호
• 정의: 코인베이스 프라임을 통해 기관 투자자들이 연속적인 매도 활동을 보이며, 이와 함께 거래량 증가와 강한 하락 추세가 나타날 때 발생
• 시각적 표현: 매도 신호가 발생한 캔들에 반투명 분홍색 바 컬러링과 함께 "Institution Selling Detected!" 라벨 표시
• 시장 해석: 기관 투자자들이 적극적으로 현물 비트코인을 매도하고 있으며, 이는 곧 가격 하락으로 이어질 가능성이 높음을 의미
• 신호 강도 요소:
▶ 연속적인 가격 하락 패턴
▶ 평균보다 높은 거래량
▶ 강한 하락 추세 강도 측정값
▶ 유의미한 가격 변동
─────────────────────────────────────
◆ 추세 강도 이해하기
■ 추세 강도 측정 방식
• 정의: 최근 일정 기간 동안의 상승/하락 캔들 비율을 분석하여 추세의 강도를 측정
• 시각적 표현: 테이블에 "BULL STRENGTH" 또는 "BEAR STRENGTH"로 표시되며, 백분율 값과 함께 "STRONG" 또는 "WEAK" 상태 표시
• 강도 임계값: 사용자가 설정 가능한 임계값에 따라 강함/약함 판정
• 계산 방식:
▶ 상승 추세 강도 = (상승 캔들 수) / (전체 분석 기간)
▶ 하락 추세 강도 = (하락 캔들 수) / (전체 분석 기간)
▶ 강도가 임계값 이상일 때 "STRONG", 미만일 때 "WEAK"로 표시
■ 추세 강도의 활용
• 신호 필터링: 추세 강도가 강할 때만 신호를 생성하여 허위 신호 감소
• 추세 확인: 현재 시장 추세의 건전성과 지속 가능성 평가
• 진입/퇴출 결정: 강한 추세에서 진입하고 약한 추세로 전환될 때 퇴출 고려
• 리스크 관리: 약한 추세에서는 포지션 크기를 줄이고, 강한 추세에서는 늘리는 전략 수립 가능
─────────────────────────────────────
◆ 실전 트레이딩 응용
■ 기관 매수 신호 활용 전략
• 추세 전환 시나리오:
▶ 설정: 하락 추세 중 강한 기관 매수 신호 발생
▶ 진입: 신호 확인 후 다음 캔들에서 매수
▶ 손절: 신호 캔들의 저점 아래
▶ 이익실현: 이전 주요 저항선 도달 시 또는 추세 강도가 약해질 때
• 추세 지속 시나리오:
▶ 설정: 상승 추세 중 조정 후 기관 매수 신호 발생
▶ 진입: 신호 확인 후 매수
▶ 손절: 최근 주요 저점 아래
▶ 이익실현: 추세 강도를 고려하여 단계적으로 이익실현
■ 기관 매도 신호 활용 전략
• 추세 전환 시나리오:
▶ 설정: 상승 추세 중 강한 기관 매도 신호 발생
▶ 진입: 신호 확인 후 다음 캔들에서 매도
▶ 손절: 신호 캔들의 고점 위
▶ 이익실현: 이전 주요 지지선 도달 시 또는 추세 강도가 약해질 때
• 추세 지속 시나리오:
▶ 설정: 하락 추세 중 반등 후 기관 매도 신호 발생
▶ 진입: 신호 확인 후 매도
▶ 손절: 최근 주요 고점 위
▶ 이익실현: 추세 강도를 고려하여 단계적으로 이익실현
■ 다중 시간프레임 접근법
• 상위 시간프레임 방향성 확인:
▶ 일봉/4시간봉에서 기관 신호 및 추세 강도 확인
▶ 주 트레이딩 방향 설정에 활용
• 하위 시간프레임 진입점 찾기:
▶ 상위 시간프레임 방향과 일치하는 하위 시간프레임 신호 대기
▶ 정밀한 진입점 포착에 활용
• 시간프레임 간 신호 일치 확인:
▶ 여러 시간프레임에서 동일한 방향의 신호가 발생할 때 신호 강도 증가
▶ 높은 확률의 트레이딩 기회 포착
─────────────────────────────────────
◆ 지표 설정 가이드
■ 주요 설정 매개변수
• Institutional Continuity Period (기관 연속성 확인 기간):
▶ 목적: 기관의 연속적인 매수/매도 활동을 확인할 기간 설정
▶ 낮은 값: 더 많은 신호 생성, 반응성 증가
▶ 높은 값: 신호 수 감소, 신뢰성 증가
• Trend Strength Threshold (추세 강도 임계값):
▶ 목적: 추세가 강하다고 판단할 최소 임계값 설정
▶ 낮은 값: 더 많은 신호, 낮은 필터링
▶ 높은 값: 더 강한 추세에서만 신호 생성, 높은 필터링
─────────────────────────────────────
◆ 다른 지표와의 시너지
• 지지/저항 레벨:
▶ 주요 지지/저항 레벨에서 발생하는 기관 신호는 확률이 더 높음
▶ 기술적 분석의 핵심 레벨과 기관 활동의 결합은 강력한 시그널 제공
• 이동평균선:
▶ 주요 이동평균선(50MA, 200MA) 근처에서 발생하는 기관 신호 주목
▶ 이동평균선 돌파와 기관 신호가 일치할 때 강한 추세 변화 가능성
• RSI/모멘텀 지표:
▶ 과매수/과매도 상태에서 발생하는 기관 신호는 반전 가능성 높임
▶ 모멘텀 다이버전스와 기관 신호의 일치는 강력한 반전 신호
• 볼륨 프로파일:
▶ 높은 볼륨 노드에서 발생하는 기관 신호는 중요한 가격 레벨 확인
▶ 주요 거래 영역에서의 기관 활동은 가격 방향에 큰 영향 미침
• 시장 구조:
▶ 주요 시장 구조(높은 고점/저점, 낮은 고점/저점) 근처에서 발생하는 기관 신호는 구조 변화 암시
▶ 시장 구조 변화와 기관 활동의 일치는 중요한 추세 전환점 표시
─────────────────────────────────────
◆ 결론
Coinbase Institutional Smart Money Detector는 코인베이스 프라임을 통한 기관 투자자들의 현물 비트코인 거래 활동을 실시간으로 추적하여 트레이더들에게 귀중한 통찰력을 제공합니다. 어떤 거래소의 비트코인 차트에도 적용 가능하기 때문에, 여러분이 선호하는 트레이딩 플랫폼에서 바로 활용할 수 있습니다.
이 지표의 핵심 가치는 일반 트레이더들이 접근하기 어려운 기관 자금 흐름 데이터를 직관적으로 시각화하여 제공한다는 점입니다. 연속적인 가격 움직임, 거래량 증가, 그리고 추세 강도를 종합적으로 분석하여 기관의 활동을 포착함으로써, 여러분은 시장의 큰 손들과 함께 움직일 수 있는 기회를 얻게 됩니다.
코인베이스 프라임 데이터를 기반으로 한 명확한 매수/매도 신호와 실시간 추세 강도 측정은 트레이더들이 시장 상황을 한눈에 파악하고 신속하게 전략적 결정을 내릴 수 있게 도와줍니다. 이 강력한 도구를 여러분의 트레이딩 전략에 통합함으로써, 시장의 스마트 머니가 어디로 흘러가는지 파악하고 그에 따라 포지셔닝할 수 있는 경쟁 우위를 확보하세요.
─────────────────────────────────────
※ 면책 조항: 모든 트레이딩 도구와 마찬가지로, Institutional Smart Money Detector는 보조 지표로 사용해야 하며 트레이딩 결정을 전적으로 의존해서는 안 됩니다. 과거의 기관 행동 패턴이 미래 시장 움직임을 보장하지는 않습니다. 항상 적절한 리스크 관리 전략을 트레이딩에 활용하세요.
